Azienda
Chi siamo
Casi di studio
Centro Stampa
Eventi
Lavora con noi
Blog
Login
Italiano
English
Deutsch
Español
Français
Português
Pусский
Prodotti
IT & OT Monitoring
Paessler PRTG
Monitora la tua intera infrastruttura IT
PRTG Network Monitor
Monitoraggio per IT di piccole e medie dimensioni
PRTG Enterprise Monitor
Monitoraggio per IT di dimensioni grandi e molto grandi
PRTG Hosted Monitor
Monitoraggio hosted per IT ibride e cloud
Estensioni per Paessler PRTG
Estendere il monitoraggio a un nuovo livello
Intelligenza IT
Qbilon
Piattaforma di analisi e automazione
per ambienti IT ibridi
Prezzi
Soluzioni
Settori
Monitoraggio in diversi settori
Industria
Sanità
Edificio
Istruzione
Servizi finanziari
Pubblica amministrazione
Argomenti IT
Monitoraggio di tutte le aree IT
Applicazione
Cloud
Database
Hardware
Prestazioni
Rete
Casi d'uso
Monitoraggio di casi d'uso speciali
Ampie infrastrutture IT
Data center
TVCC
SAP
Servizi
PRTG Training
Impara a lavorare con PRTG
PRTG Consulting
Consigli di monitoraggio da parte di esperti
PRTG Support
Beneficiare di un supporto premium
Risorse
Per iniziare
Moduli per l'autoapprendimento
Guide pratiche
Trai il massimo da PRTG
Video & Webinar
Impara dagli esperti Paessler
Conoscenza dell'IT
Amplia le tue conoscenze IT
Manuale PRTG
Documentazione completa
Knowledge Base
Lasciati coinvolgere con Q&A
PRTG Sensor Hub
Ricevi sensori, script e modelli
Partners
Trova un Partner
Scopri i rivenditori mondiali
Partner tecnologici
Le nostre collaborazioni tecnologiche
Portale Partner
Diventa un Partner Paessler
Azienda
Chi siamo
Casi di studio
Centro Stampa
Eventi
Lavora con noi
Blog
Login
Italiano
English
Deutsch
Español
Français
Português
Pусский
Prova gratuita
Home
>
Paessler PRTG
>
Funzioni
Sfrutta tutte le funzioni di monitoraggio di cui hai bisogno
Indipendentemente dal prodotto PRTG prescelto
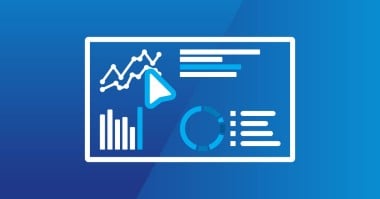
Mappe e dashboard
Visualizza la tua rete come più ti occorre
Utilizza mappe in tempo reale con informazioni live sullo stato
Crea utili dashboard con il PRTG map designer
Maggiori informazioni
Avvisi e notifiche
Ricevi avvisi quando ci sono problemi o misurazioni insolite
Imposta soglie di monitoraggio personalizzate
Sfrutta i metodi di notifica incorporati (e-mail, push, richieste HTTP e molto altro)
Maggiori informazioni
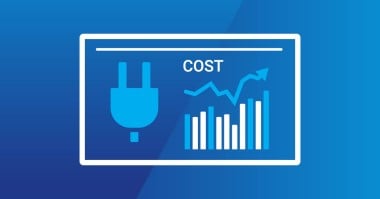
Reportistica altamente personalizzabile
I report di PRTG sono più che semplici colonne di numeri
Personalizza i modelli di report in base alle tue esigenze
Informa gli altri circa lo stato della tua infrastruttura IT in maniera efficiente e affidabile
Maggiori informazioni
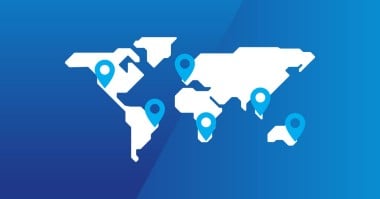
Monitoraggio distribuito
Monitoraggio distribuito su un singolo pannello in vetro
Monitora un numero illimitato di sedi remote
Unifica i dati in un’unica dashboard centralizzata di facile lettura
Maggiori informazioni
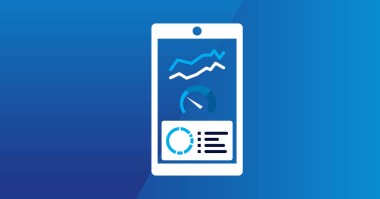
Interfacce utente multiple
Sfrutta le possibilità offerte dalla nostra interfaccia Web
Modifica di più oggetti di monitoraggio contemporaneamente con la app PRTG per desktop
Utilizza le nostre app PRTG per iOS e Android per effettuare il monitoraggio ovunque ti trovi
Maggiori informazioni
Centinaia di migliaia di clienti in tutto il mondo amano Paessler PRTG
Cosa dicono di noi i nostri clienti