
Part 1: Support for your support
If you break down the functions of a network monitoring solution, three core elements remain:
collection / archiving of data, analysis of data & publishing data / alerts.
This functionality provides, everything you need for a "central information platform"! With minimal effort you can do what other standard network monitoring solutions cannot by leveraging PRTG's API, custom sensors, business process sensors and maps.
Optimize Your Customer Support
Set up your own support dashboard and track the number of current tickets, the ticket-trend for the last day, week and year, the late shift calendar, the status of the ticket email system and some general information such as traffic around the headquarters or status information of your international data centers. We already do that here at Paessler and it helps us a lot to efficiently plan our support resources.
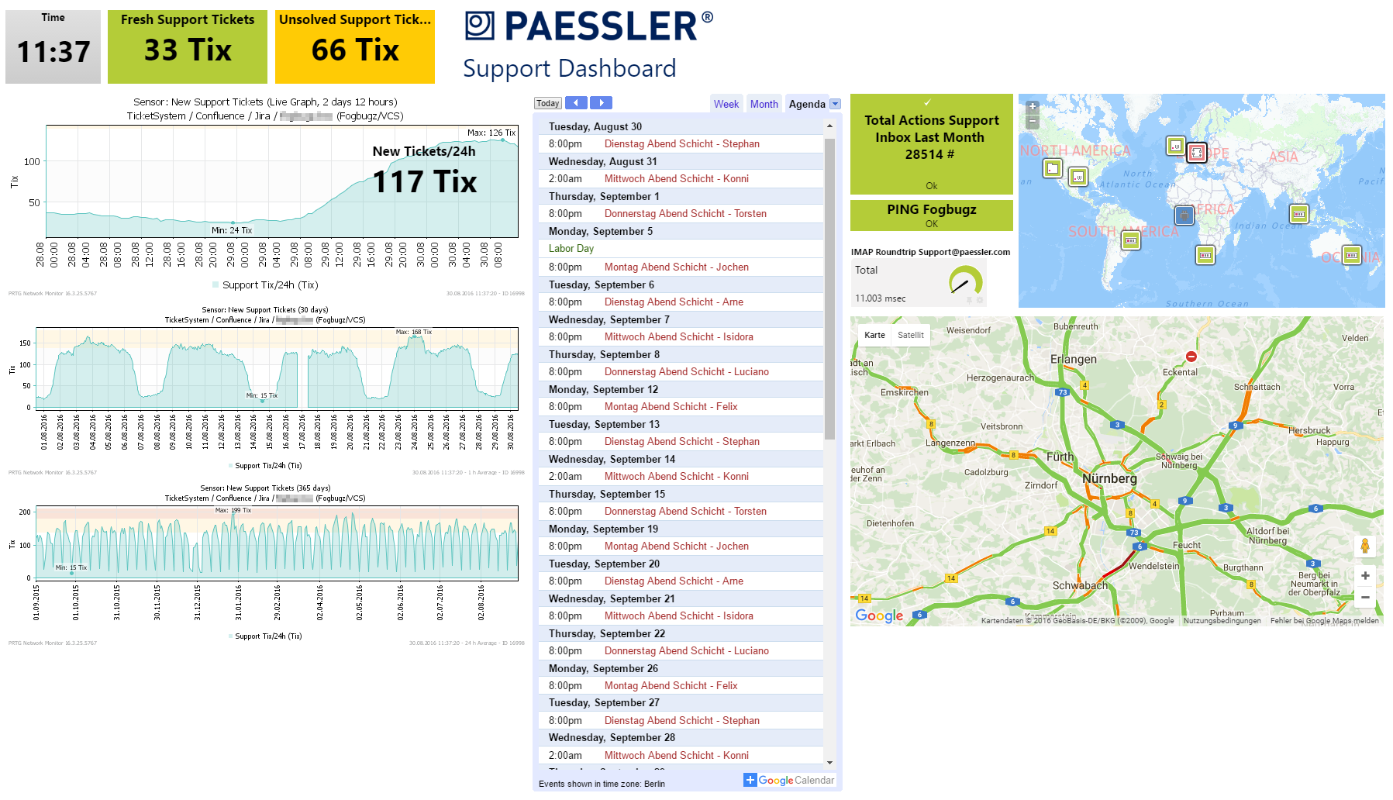
The Paessler Tech Support Map shows everything the support team needs to know for their daily work.
Learn more about how to benefit from such maps and how to implement relevant escalation levels in the first part of our blog series about PRTG as central information hub.
Cheers,
![]()
P.S. If you have any feedback or questions, please contact us at [email protected]. We are happy to help.

You are receiving this newsletter because you have been in contact with us regarding PRTG Network Monitor.