![]()
Monitoring DHCP with PRTG

Ensure the DHCP Server
service is running
Check that DHCP is
allocating addresses
Check the response time
of your DHCP Servers
Be notified when address pools are running low
What is DHCP?
Dynamic Host Configuration Protocol, or DHCP, is a vital component in most network infrastructures. Its purpose is to automatically assign IP addresses to client devices connecting to the network. Without DHCP, administrators would have to manually assign IPs to every device on the network – a time-consuming and error-prone exercise.
Why DHCP Monitoring is important
Since the DHCP server is responsible for assigning IP addresses on your network, a failure in this sphere could cause serious problems. When there is a DHCP issue newly connected devices are assigned a default Class B IP address. In this fallback configuration, they cannot communicate with other devices or be reached on the network. A point to note is that similar problems can occur when the address space assigned to the DHCP server is exhausted.
What is DHCP monitoring?
With DHCP monitoring you can always see whether your DHCP server is running as it should. And in case of problems, you will be promptly notified by PRTG so that you can intervene in a timely manner. In most cases, this will enable you to fix the problem before it even becomes noticeable on the network.
3 important aspects of DHCP
![]() How PRTG defines sensors
How PRTG defines sensors
In PRTG, “sensors” are the basic monitoring elements. One sensor usually monitors one measured value in your network, e.g. the traffic of a switch port, the CPU load of a server, the free space of a disk drive. On average you need about 5-10 sensors per device or one sensor per switch port.
There are three important aspects of DHCP that administrators should be monitoring, and PRTG can help with them all.
![]()
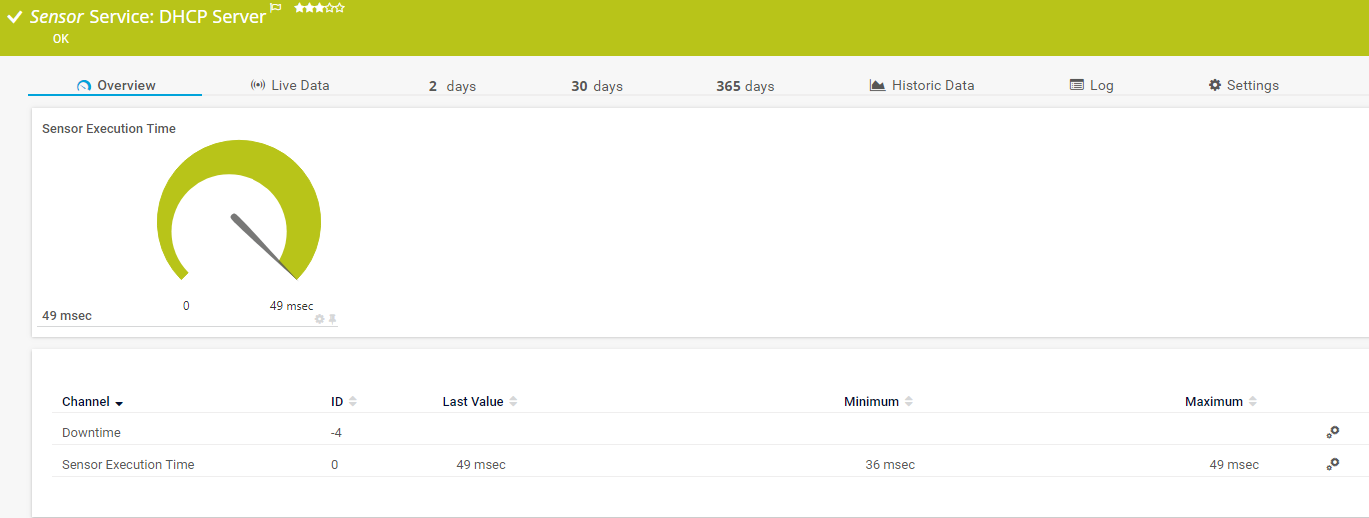
Firstly, admins need to make sure that the DHCP service is actually running. In most AD environments, the Domain Controllers usually run the DHCP service. So, by applying a simple WMI Service Sensor and configuring it to watch the “DHCP Server Service”, the admin will always know the state of the service. Should the service stop, PRTG can be configured to automatically try to restart the service, and inform the admin if the attempt was successful:
![]()
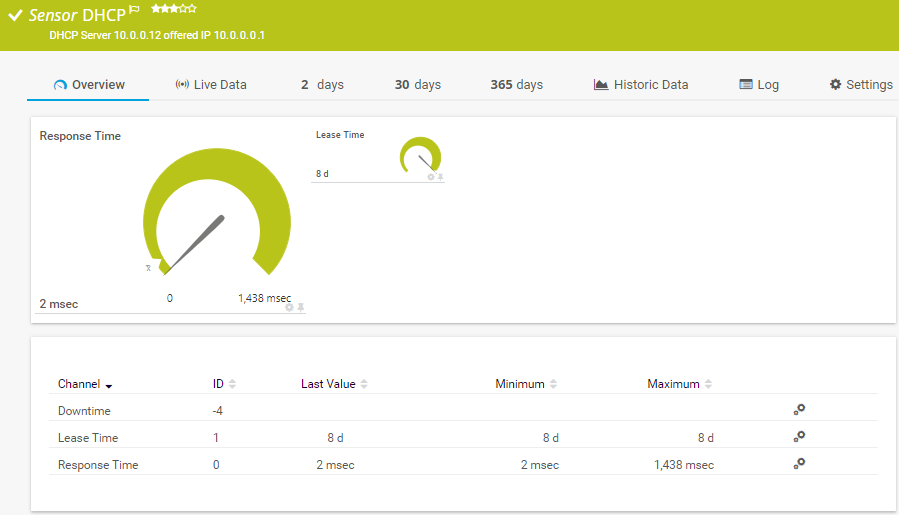
The second important test is to see if the server is actually allocating addresses. This is where the dedicated PRTG DHCP Sensor comes into play. It will send a broadcast message out to the network, requesting an IP address, and then waits for a DHCP to respond. The sensor then reports on how long it takes for the server to respond, the IP of the responding server, the allocated IP address and its lease duration.
![]()
The final important metric for DHCP servers is how many IP addresses are available for the allocation to clients. DHCP servers are configured with ranges of IP addresses, the so-called DHCP scopes. A DHCP server semi-randomly chooses an IP address from its scope to allocate it to a client that connects to the network. Such an IP address has a configurable lease time or lifespan, and administrators must take care to balance the length of these leases with the size of the available scope, and the number of anticipated clients.
![]()
This is where PRTG can help. By using an EXE/Script Advanced sensor that runs a custom PowerShell script, admins can easily keep track of their DHCP scope status. Find more information and the PowerShell script in our Knowledge Base: Single sensor to display DHCP scope status.
A sneak peek at monitoring with PRTG
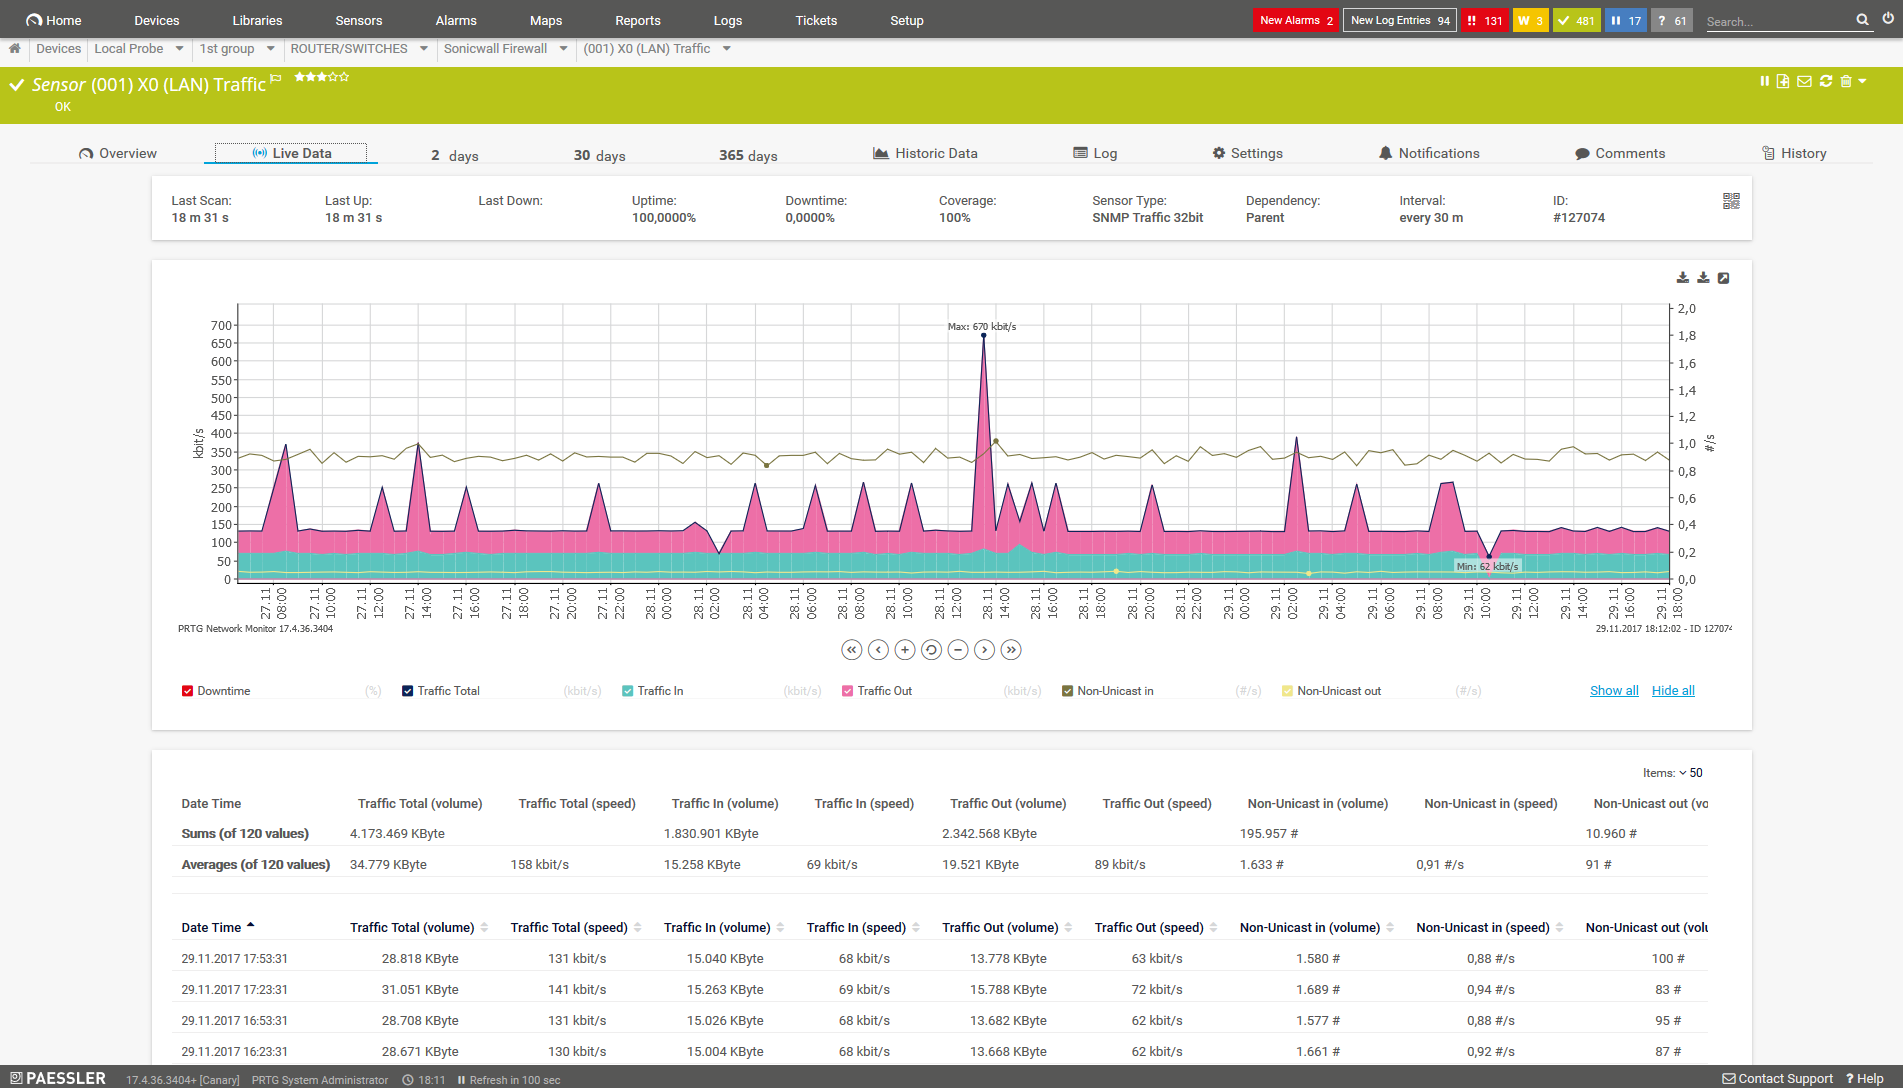
Live Traffic Sensor

"Sunburst" dashboard in PRTG
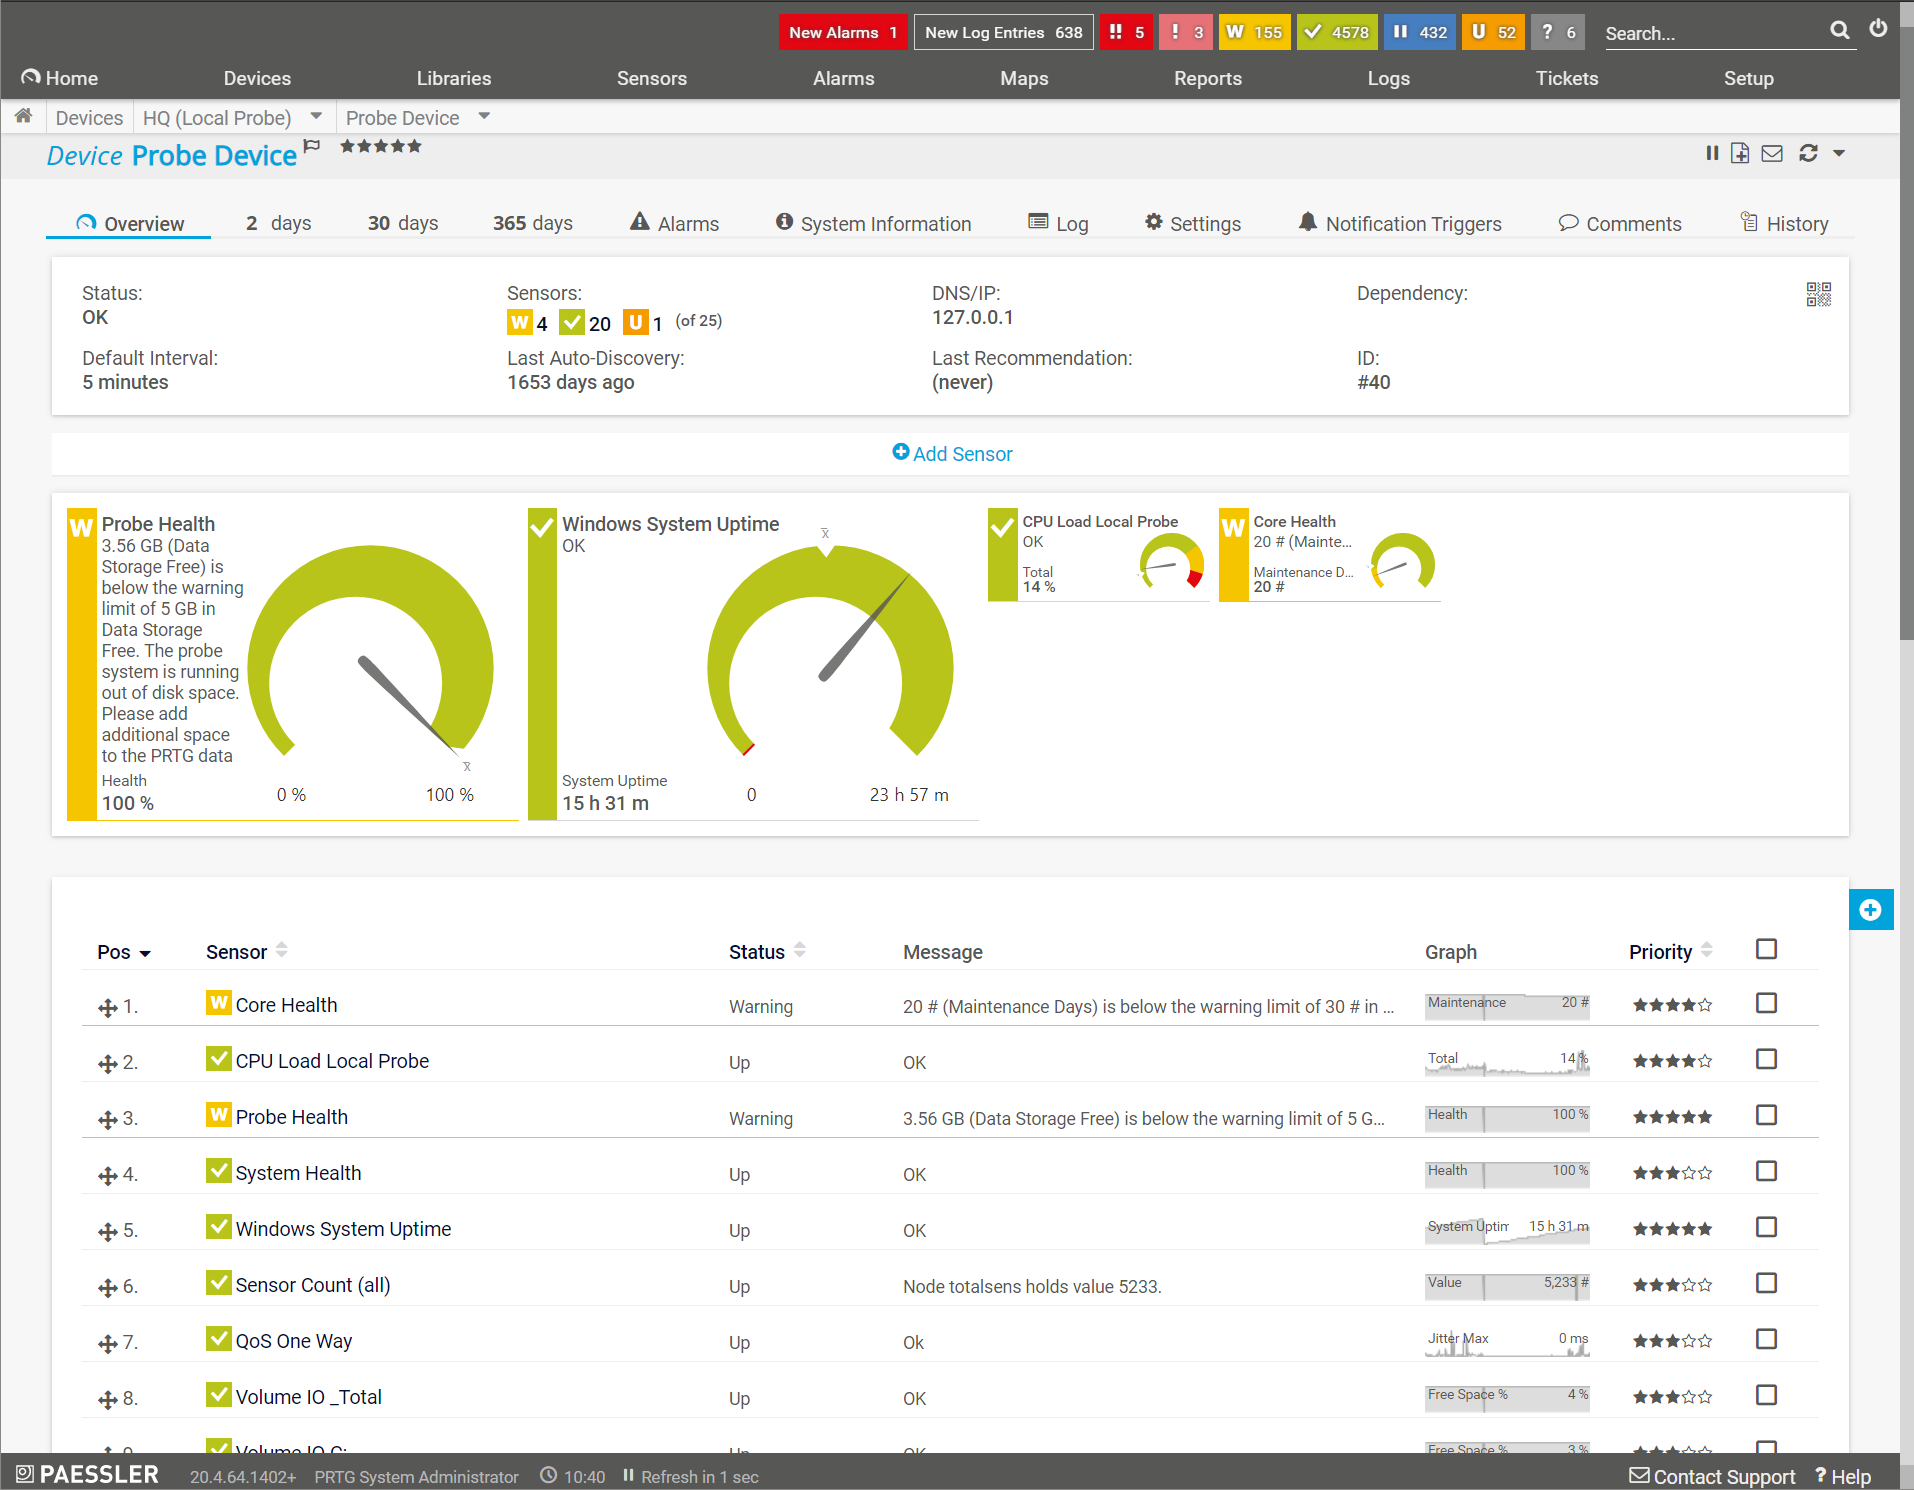
PRTG Network Monitor: Device overview
PRTG makes your job easier
Our monitoring software frees you to focus on other tasks by promptly notifying you of potential issues.
![]()
Save effort
PRTG gives you one central monitoring tool for your servers and entire network. Enjoy a quick overview of your whole infrastructure via our dashboard and app.
![]()
Save time
Getting started with PRTG is a breeze. Setting up or switching from another network monitoring tool is easy thanks to the auto-discovery and pre-configured device templates.
![]()
Save money
80% of our customers report substantial cost savings with network monitoring. Your costs of licenses will likely pay for themselves within weeks.
![]()
“We can all work with greater peace of mind knowing
that our systems are constantly being monitored.”
Markus Puke, Network Administrator, Schüchtermann Klinik, Germany


Trusted by 500,000 users and recognized
by industry analysts as a leader

“Fantastic network and infrastructure monitoring solution that is easy to deploy and easier still to use. Simply the best available.”

“Software is absolutely perfect, Support is superior. Meets all needs and requirements, this is a must have solution if you are needing any form of monitoring.”

“The tool excels at its primary focus of being a unified infrastructure management and network monitoring service.”


“Easy to implement and configure with good technical support.”
R. v. S., ICT Manager at Heinen & Hopman Eng BV
We asked: would you recommend PRTG?
Over 95% of our customers say yes!
Paessler AG conducted trials in over 600 IT departments worldwide to tune its network monitoring software closer to the needs of sysadmins.
The result of the survey: over 95% of the participants would recommend PRTG – or already have.


PRTG: The multi-tool for sysadmins
Adapt PRTG individually and dynamically to your needs and rely on a strong API:- HTTP API: Access monitoring data and manipulate monitoring objects via HTTP requests
- Custom sensors: Create your own PRTG sensors for customized monitoring
- Custom notifications: Create your own notifications and send action triggers to external systems
- REST Custom sensor: Monitor almost everything that provides data in XML or JSON format
Still not convinced?
![]()
More than 500,000 sysadmins love PRTG
Paessler PRTG is used by companies of all sizes. Sysadmins love PRTG because it makes their job a whole lot easier.
Still not convinced?
![]()
Monitor your entire IT infrastructure
Bandwidth, servers, virtual environments, websites, VoIP services – PRTG keeps an eye on your entire network.
![]()
Try Paessler PRTG for free
Everyone has different monitoring needs. That’s why we let you try PRTG for free. Start now with your trial.
|
PRTG |
Network Monitoring Software - Version 24.2.94.1400 (April 10th, 2024) |
|
Hosting |
Download for Windows and cloud-based version PRTG Hosted Monitor available |
Languages |
English, German, Spanish, French, Portuguese, Dutch, Russian, Japanese, and Simplified Chinese |
Pricing |
Up to 100 sensors for free (Price List) |
Unified Monitoring |
Network devices, bandwidth, servers, applications, virtual environments, remote systems, IoT, and more |
Supported Vendors & Applications |
|
Combining the broad monitoring feature set of PRTG with IP Fabric’s automated network assurance creates a new level of network visibility and reliability.