![]()
All-in-one Windows monitoring with PRTG
- Use WMI, Windows performance counters & SNMP to monitor Windows
- Keep an eye on Windows Event Logs and Windows security
- Benefit from customizable sensors to fit your Windows Server monitoring needs
Our users give top ratings for monitoring with Paessler PRTG


PRTG Windows monitoring: What you’ll find on this page

- 5 reasons to choose PRTG Windows monitoring software
- Discover preconfigured sensors for Windows monitoring with PRTG
- What Windows monitoring looks like in PRTG
- Solve Windows uptime challenges with PRTG
- Why switch to PRTG Windows monitoring tools?
- Pro Tip: Keep an eye on devices with the PRTG System Information feature
- Monitor Windows: FAQ
PRTG makes Windows performance monitoring easy
Custom alerts and data visualization make it easy to monitor, identify, and prevent Windows network traffic and server performance issues.
5 reasons to choose PRTG Windows monitoring software
Improve security and strive for 100% availability with these benefits.
Continuous overview of your entire Windows network
Paessler PRTG provides an all-in-one overview of your entire network, including Windows processes, system availability, databases, mail servers, web servers, virtual servers, and more. Get peace of mind with customizable alerting that cover CPU usage, memory, disk space, and traffic, among others.
![]()
The right technology for any Windows Server version
PRTG uses Windows Management Instrumentation (WMI), Windows performance counters, or SNMP, which generates significantly lower loads for its Window server monitoring. Our network monitor for Windows works with all the current versions of Windows Server.
Customizable features for faster troubleshooting
You can customize PRTG for monitoring numerous parameters in Windows and configure the alarm feature to receive notifications by email, SMS, push, and more, to catch specific problems as they arise. You’ll also see valuable historical data to help you observe availability over a longer period of time, making it easier to get to the root of sudden crashes.
![]()
Built-in Windows Event Log monitoring and analysis
PRTG analyzes Windows Event Log files by default, including application and system logs. For example, if an error occurs in the Windows operating system, a preconfigured PRTG sensor immediately sounds the alarm so you can fix the issue before it becomes business critical.
Comprehensive and reliable Windows security monitoring
PRTG retrieves security-related data (such as the status of antivirus software) in the Windows Security Center and integrates it into your monitoring overview. You get a constant overview via your dashboard so you can even keep an eye on things even while on the go using almost any mobile device.
“All-around winning “The real beauty of PRTG is the endless possibilities it offers” “Outstanding cloud IT experts agree: Paessler PRTG is a great solution for IT infrastructure monitoring

network monitor”

monitoring”
Start monitoring Windows with PRTG and see how it can make your network more reliable and your job easier.
Discover preconfigured sensors for Windows monitoring with PRTG
PRTG comes with predefined Windows and WMI sensors for monitoring conventional parameters such as CPU, memory, disk health, and the network card. You can also customize many more sensors for other tasks. Here are some of our sensors for monitoring Windows.
Windows System Uptime
The Windows System Uptime sensor monitors the uptime of Windows-based systems.
Windows Updates Status (PowerShell)
The Windows Updates Status (PowerShell) sensor monitors the status of Windows updates on a computer and counts the available and installed Windows updates that are either from Microsoft or from the local WSUS server.
WMI Event Log and Event Log (Windows API)
The WMI Event Log and the Event Log (Windows API) sensors read Windows Event Log entries using different technologies.
WMI Security Center
The WMI Security Center sensor monitors any product that can be inspected by the Windows Security Center.
PerfCounter Custom
The PerfCounter Custom sensor monitors an individually compiled set of Windows performance counters.
WMI Custom
The WMI Custom sensor uses WMI to execute an individual WQL query and monitors the subsequent return value.
What Windows monitoring looks like in PRTG
Diagnose network issues by continuously monitoring Windows. Show Windows perfmon stats in real time and visualize data in graphic maps & dashboards to identify problems more easily. Gain the visibility you need to troubleshoot the availability, health, and performance of your entire Windows-based infrastructure.

Sunburst view of the entire monitoring setup
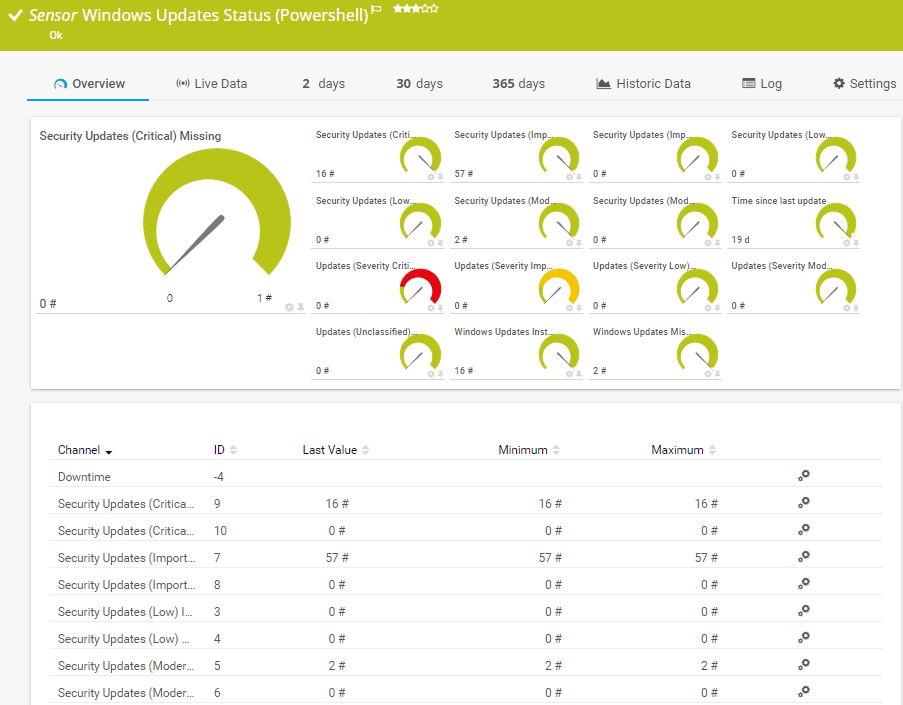
Windows Updates Status (PowerShell) sensor in PRTG
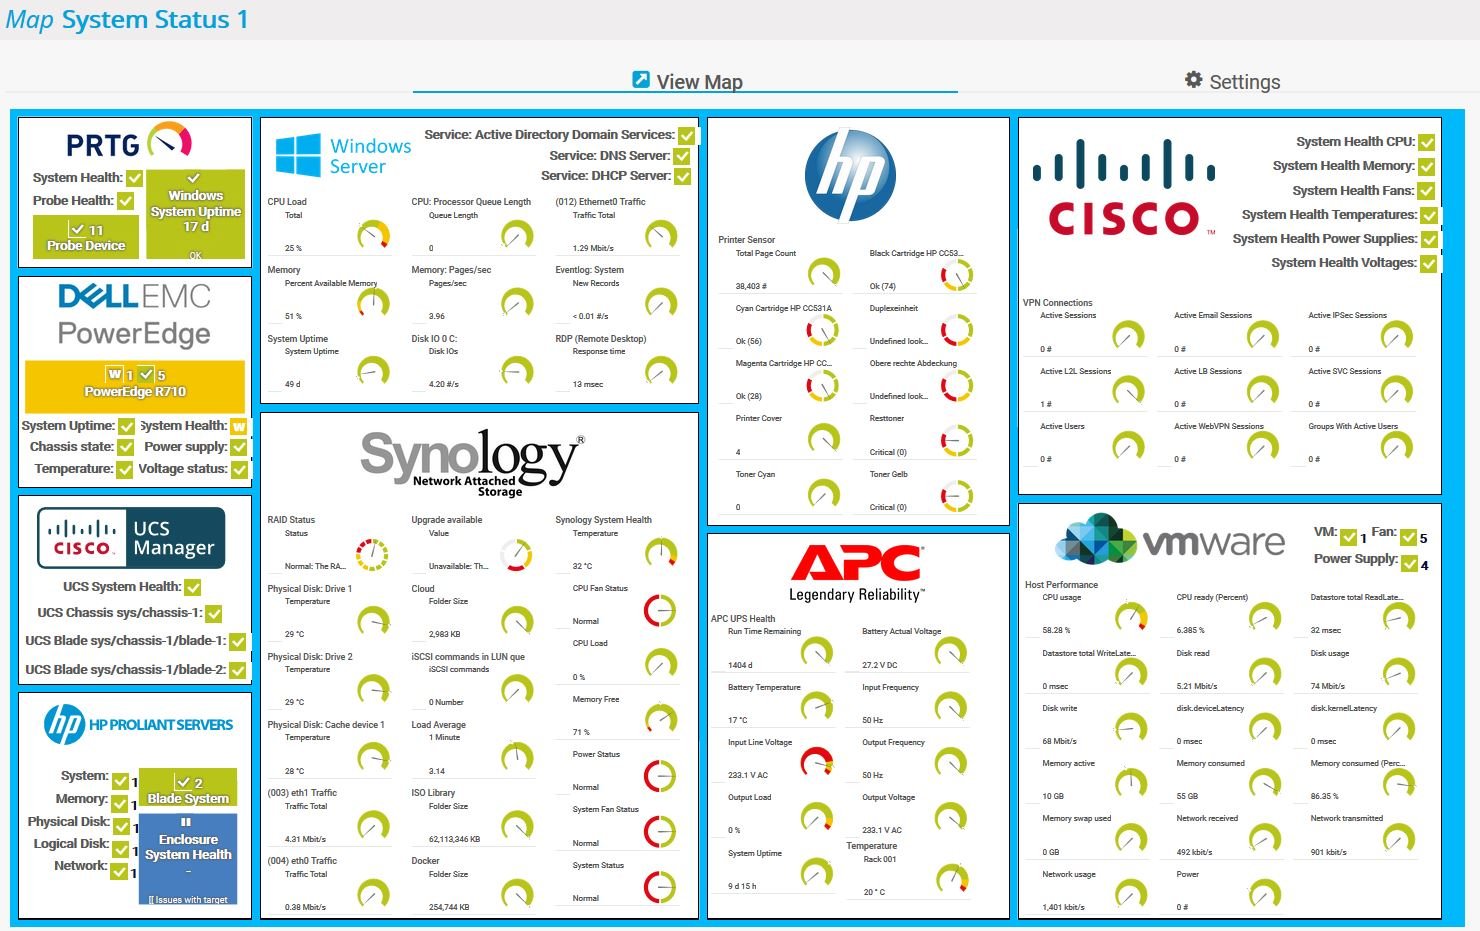
Custom PRTG dashboard showing the system status of different devices
PRTG is compatible with all major vendors, products, and systems
![]()
Easily find the source of the problem with our PRTG Windows server monitoring solution
Real-time alerts and custom notifications make it easy to solve issues with your Windows clients and servers
Solve Windows uptime challenges with PRTG
The Windows update problem
To execute pending updates in Windows systems, a reboot is usually required. As a result, the computer or server shuts down during the update and then restarts, creating downtime that can lead to applications being unavailable, causing work interruptions and even losses in sales.
Many administrators solve the “update problem” by distributing services across several servers (Windows clustering) to ensure important systems stay available during downtime, which can also occur during other situations besides updates.
How PRTG can help
PRTG keeps a constant eye on uptime and helps you compile comprehensive statistics. This lets you show your colleagues and higher-ups that you have a firm grip on your network, even during Windows updates.
Show Windows uptime
There are several options for viewing uptime (runtime), such as using the command line. If you enter the command “Systeminfo” into a Windows command-line tool, Windows will display the “System Boot Time,” or the date and time when the system was last rebooted.
Another option is the Task Manager’s “Performance” tab, where the CPU’s “Up Time” is displayed in days, hours, minutes, and seconds. However, these manual checks can become very tedious the larger your infrastructure is.
How PRTG can help
PRTG provides you with a constant overview of the uptime of your Windows systems. Gone are the days of having to check uptime manually – PRTG automatically displays it on your dashboard. In the event of a malfunction, you will immediately be notified you so you can keep downtime to a minimum.
PRTG makes Windows performance monitoring easy
Custom alerts and data visualization make it easy to monitor, identify, and prevent Windows network traffic and server performance issues.
Why switch to PRTG Windows monitoring tools?
One centralized tool
PRTG is a comprehensive network monitoring tool that covers all your monitoring needs. You get a 24/7 global overview of your entire IT infrastructure. This means you can stop juggling separate specialized tools that offer only isolated solutions and cost precious time.
Tried and tested solutions
PRTG offers monitoring solutions which have been tested, refined, and perfected for years. You’ll never again need to continuously program new interfaces – it’s all done already, thanks to our dedicated developer team focused entirely on PRTG.
![]()
Easy configuration
Our automatic network discovery makes PRTG configuration a breeze. During setup, simply enter an IP address range and PRTG will search for available devices and add predefined sensors. This means you can get started with some initial monitoring the very first time you open the software.

PRTG: The multi-tool for sysadmins
Adapt PRTG individually and dynamically to your needs and rely on a strong API:- HTTP API: Access monitoring data and manipulate monitoring objects via HTTP requests
- Custom sensors: Create your own PRTG sensors for customized monitoring
- Custom notifications: Create your own notifications and send action triggers to external systems
- REST Custom sensor: Monitor almost everything that provides data in XML or JSON format
Pro Tip: Keep an eye on devices with the PRTG System Information feature
PRTG network tools for Windows include a System Information feature for every Windows device.
It displays information on your Windows system such as IP address, hardware, software, and current processes.
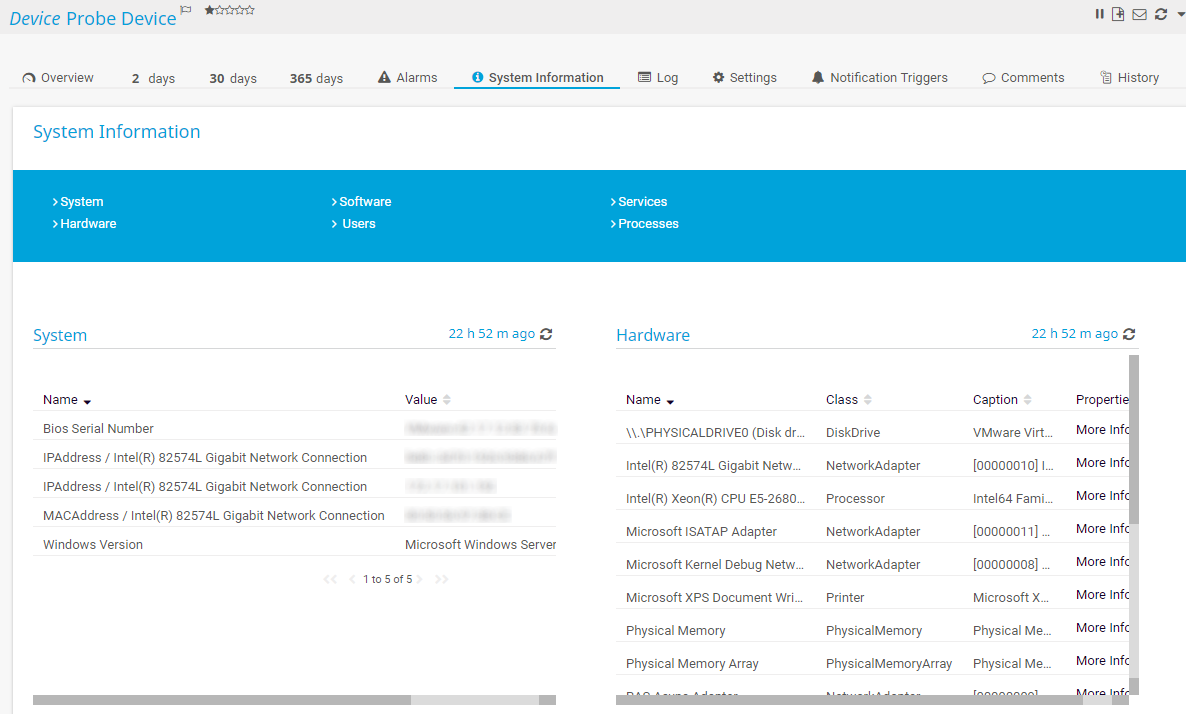
System Information feature in PRTG
Your Windows network monitor at a glance – even on the go
Set up PRTG in minutes and use it on almost any mobile device.


Create innovative solutions with Paessler’s partners
Partnering with innovative vendors, Paessler unleashes synergies to create
new and additional benefits for joined customers.

Combining their tools to a powerful solution for advanced analysis and automation, KnowledgeRiver and Paessler enable IT teams to ensure best performance for their infrastructure and networks.
KnowledgeRiver
With ScriptRunner, Paessler integrates a powerful event automation platform into PRTG Network Monitor.
ScriptRunner
Monitor Windows: FAQ
1. What is Windows monitoring?
Windows monitoring refers to the continuous observation and analysis of the performance, health, and activities of a Windows operating system. It involves tracking key metrics such as CPU usage, memory consumption, disk activity, and network traffic to identify potential issues or bottlenecks. This process is crucial for maintaining a reliable and efficient computing environment, as well as the overall stability and security of the Windows environment in both personal and enterprise settings.
2. Why should I monitor Windows operating systems?
Monitoring Windows operating systems is essential for several reasons. Firstly, it helps identify and address performance issues, ensuring optimal system efficiency. Secondly, it enables early detection of potential security threats or unauthorized activities, enhancing overall system security. Thirdly, monitoring assists in capacity planning by tracking resource usage trends and predicting future requirements. Additionally, it aids in troubleshooting and resolving problems promptly, minimizing downtime and optimizing user experience.
3. Which Windows Server versions can I monitor with PRTG?
PRTG is designed to monitor the following Windows Server versions:
- Windows Server 2016
- Windows Server 2019
- Windows Server 2022
4. Can I only monitor Windows systems with PRTG?
No. With PRTG, you can keep an eye on all kinds of operating systems, including Linux/Unix and macOS.
5. What is a sensor in PRTG?
In PRTG, “sensors” are the basic monitoring elements. One sensor usually monitors one measured value in your network, for example the traffic of a switch port, the CPU load of a server, or the free space on a disk drive.
On average, you need about 5-10 sensors per device or one sensor per switch port.
We asked: would you recommend PRTG?
Over 95% of our customers say yes!
Paessler AG conducted trials in over 600 IT departments worldwide to tune its network monitoring software closer to the needs of sysadmins.
The result of the survey: over 95% of the participants would recommend PRTG – or already have.

Paessler PRTG is used by companies of all sizes. Sysadmins love PRTG because it makes their job a whole lot easier. Bandwidth, servers, virtual environments, websites, VoIP services – PRTG keeps an eye on your entire network. Everyone has different monitoring needs. That’s why we let you try PRTG for free.Still not convinced?
![]()
More than 500,000
sysadmins love PRTG![]()
Monitor your entire IT infrastructure
![]()
Try Paessler PRTG
for free
![]()
Combining the broad monitoring feature set of PRTG with IP Fabric’s automated network assurance creates a new level of network visibility and reliability.