![]()
Monitor network activity
with PRTG

Keep an eye on all
your network activity
Monitor bandwidth, databases
and network devices
PRTG uses Flow technology, SNMP, and packet sniffing to monitor network activity
Network activity monitoring with PRTG
Monitor network activity proactively
Network activity monitoring software provides you with an overview of your entire network, and allows you to keep a constant eye on all network processes. You’ll always know if everything is OK with your network, or if something needs your attention. And that means you can react proactively to potential problems and prevent costly crashes.
Three advantages of network activity monitoring with PRTG
Maintain total control
of your network
PRTG is a powerful network monitoring solution. Our tool lets you maintain constant control of your entire network, and ensures you always know the current status of all devices and connections.
Stay informed
of network processes
A program is hogging bandwidth, network latency increases at certain times of the day, a printer has gone offline – PRTG informs you whenever something goes awry in your network. Check at any time to see if everything is OK with your network, and of course, reap the full enjoyment of obtaining an error-free report from PRTG!
Receive custom
notifications
PRTG monitors all network activity, around the clock. In the event of an error, you can choose to be informed in real time. Define an unlimited number of threshold values and incidents for which you would like to receive an automatic notification. Depending on your needs, PRTG will send your alerts by email, SMS, or push notification.
Keep a constant eye on your network activity – even while on the go
Set up PRTG in minutes and use it on almost any mobile device.


PRTG monitors network activity thoroughly and efficiently
![]() An IP address (internet protocol address) is a numerical representation that uniquely identifies a specific interface on the network. IP addresses are binary numbers but are typically expressed in decimal form (IPv4) or hexadecimal form (IPv6) to make reading and using them easier for humans.
An IP address (internet protocol address) is a numerical representation that uniquely identifies a specific interface on the network. IP addresses are binary numbers but are typically expressed in decimal form (IPv4) or hexadecimal form (IPv6) to make reading and using them easier for humans.
Read more
![]()
Bandwidth usage
Current bandwidth usage is a key figure for measuring the performance of your network. With PRTG, you can check to make sure your ISP is providing the amount of bandwidth that is promised in your agreement.
You can also see which service or server is using the most bandwidth. An easy-to-read diagram and straightforward maps let you recognize at a glance how much bandwidth is required for each protocol, IP address, and port.
![]()
Databases
When it comes to the day-to-day operations of your business, it is vital that your databases always be up and running. PRTG provides 24/7 monitoring of the query time, response time, and availability of your databases – whether they be Microsoft SQL, MySQL, PostgreSQL, or Oracle SQL.
The PRTG dashboard offers a global overview of the performance of your databases, and is entirely customizable. For a more in-depth look, use self-defined SQL queries to query specific data sets from your database, and then monitor the return value.
![]()
Network speed
Network speed is another key figure for measuring the performance of your network. Along with bandwidth, PRTG monitors the latency of your network. A spike in data transmission can result in a network bottleneck, which in turn will cause data to travel considerably slower, and in worst case scenarios provoke a crash.
PRTG clearly displays all the information you need with regard to network speed. If network speed takes a hit, you’ll be informed at once via your dashboard, or if you prefer, by way of a custom notification. PRTG measures network speed in LANs, WiFi networks and WANs.
![]()
Hardware
To obtain a comprehensive picture of network activity, you will also need to keep a constant eye on your hardware. Routers and switches are the control centers of your network and send data packets to end devices. PRTG informs you of problems before actual failures arise, which means you will be able to avoid unnecessary downtime.
How PRTG monitors network activity
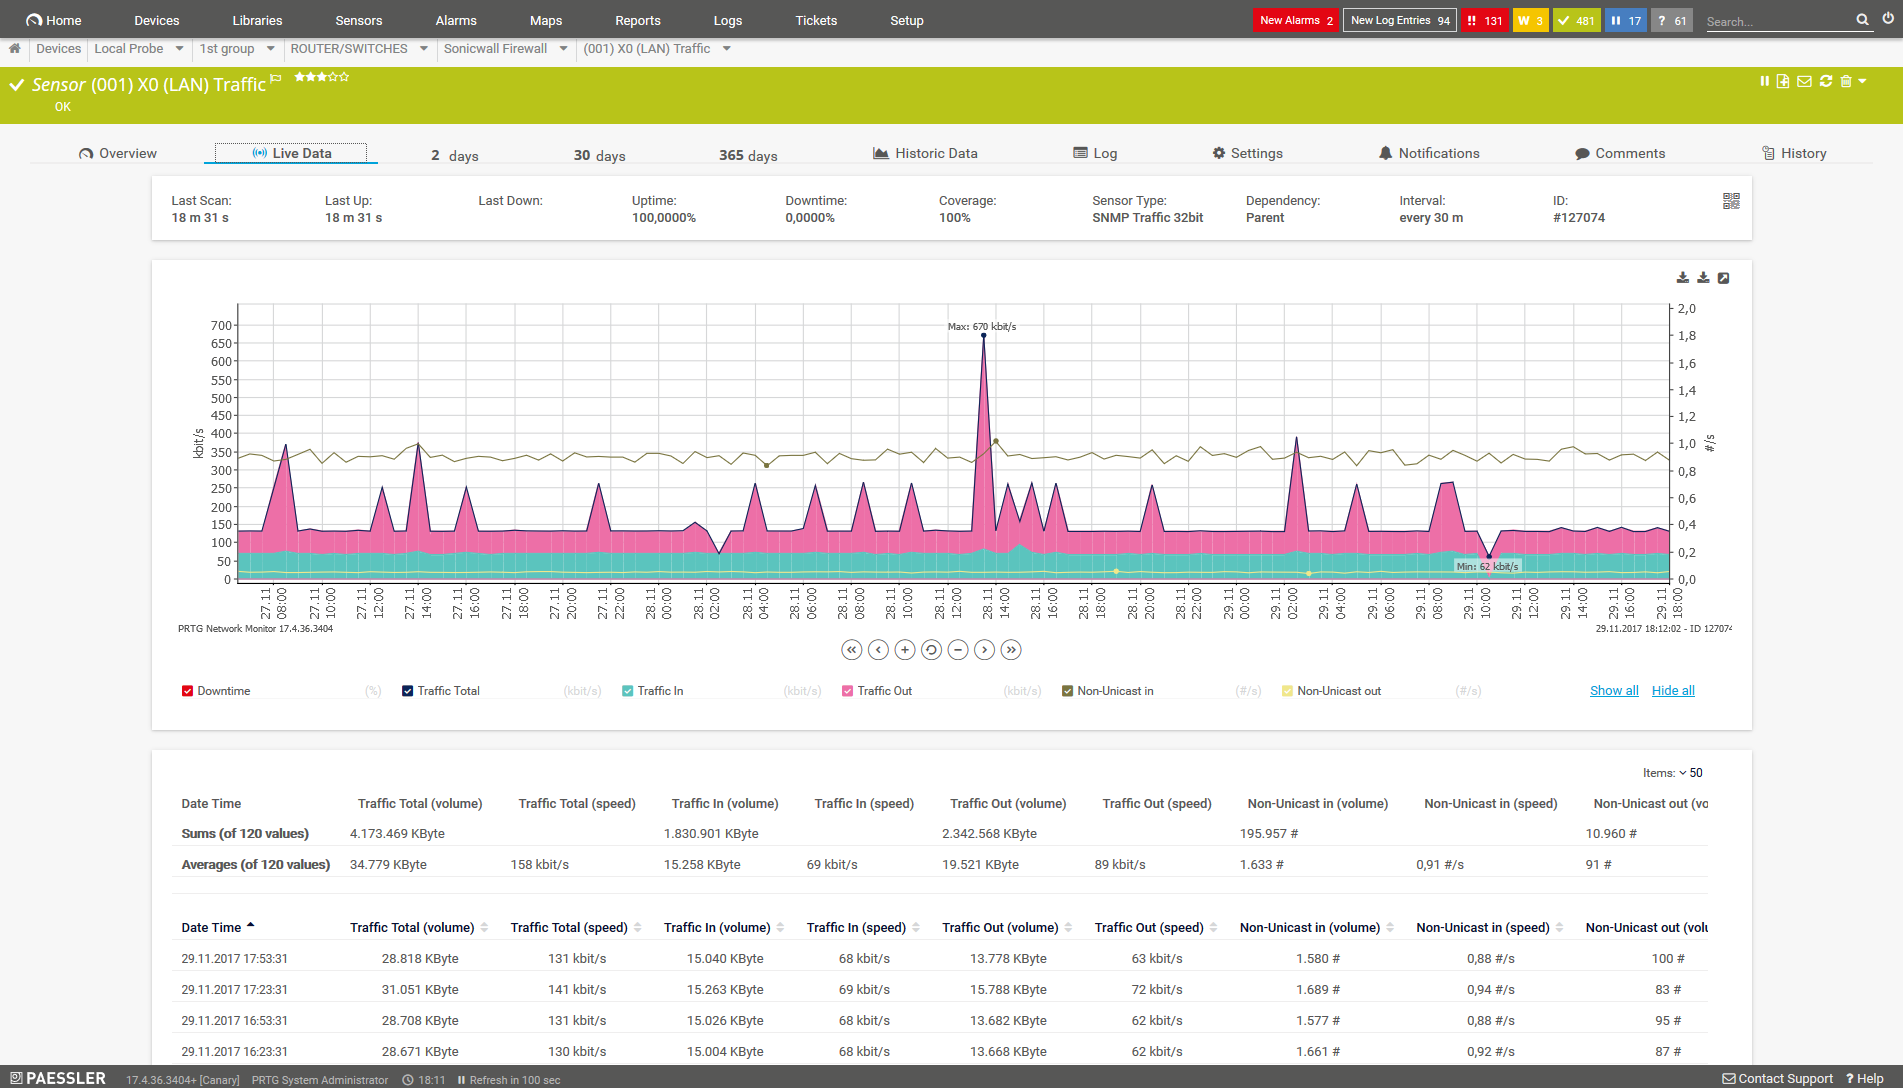
Traffic live
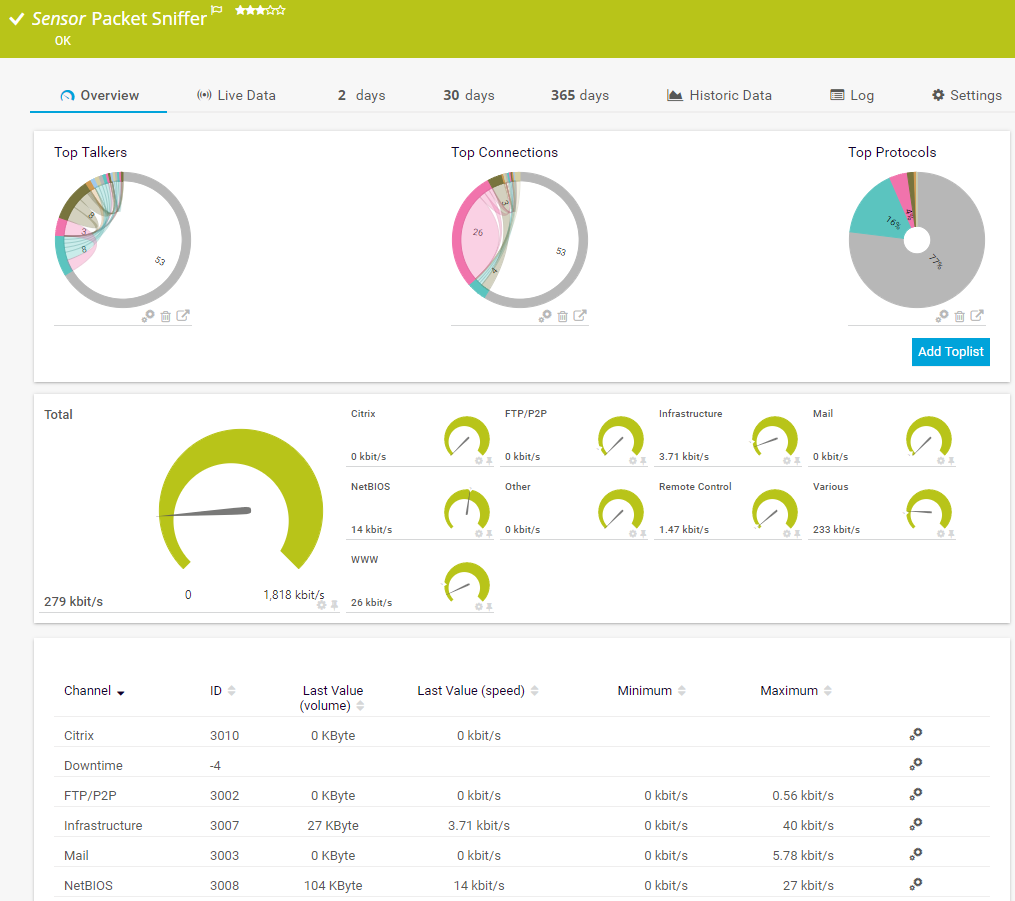
Packet Sniffer
Database monitoring with PRTG
Network Activity Monitor: Comparing 3 different technologies
![]() How PRTG defines sensors
How PRTG defines sensors
In PRTG, “sensors” are the basic monitoring elements. One sensor usually monitors one measured value in your network, e.g. the traffic of a switch port, the CPU load of a server, the free space of a disk drive. On average you need about 5-10 sensors per device or one sensor per switch port.
![]()
SNMP
SNMP is a simple protocol that can be used to monitor network activity. Its big advantage: SNMP is supported by many manufacturers and puts minimal strain on CPU and network loads. SNMP can be used to display a complete overview of your network activity. On the other hand, it does not allow for the in-depth analysis of network activity. To the SNMP Traffic sensor
![]()
Flow technology
Flow technologies (NetFlow, jFlow, sFlow, IPFIX) are highly effective at monitoring larger networks. Most of the time, these protocols are specially designed for the routers and switches of a specific manufacturer (e.g. NetFlow for Cisco), but often they are supported by other manufacturers as well. To the Flow sensors
![]()
Packet Sniffer
Packet sniffing allows for the detailed analysis of network activity according to IP addresses, protocols, and data types. Because this monitoring is more comprehensive, it tends to put a greater strain on your CPU and network loads. To the Packet Sniffer sensor
Monitor network activity in different locations
Thanks to its remote probes, PRTG is not only LAN monitoring software, but can also be used to monitor network activity at a variety of different locations.
Simply install PRTG on one computer in your network (the PRTG Core Server) and then add one or more remote control to some others.
These probes gather monitoring data in the network to be monitored, and then send this data to the PRTG server for analysis. Remote probes can be installed in the same environment as the PRTG Core Server, or in a different network at a separate site. The only requirement is that the probes communicate continually with the server via the network or Internet.
This feature is invaluable, in particular for service providers or companies with multiple subsidiaries. PRTG lets you centrally monitor several different locations or customer networks with just one installation (and one license!).
You’ll therefore not only save time spent on administration, but also cold hard cash!
Overview: SNMP, Packet Sniffer, Flow
|
| SNMP | Packet Sniffer | Flow (IPFIX, NetFlow, |
|---|---|---|---|
| Setup | Easy | Easy to complex (depending on | Can be complex |
| Traffic can be filtered |
|
| |
| Differentiate bandwidth usage by protocol or IPs |
|
|
|
| PRTG can show Toplists (Top Talker, Top Connections, Top Protocols, custom) |
|
|
|
| Filter bandwidth usage by IP |
|
| |
| Filter bandwidth usage by MAC address |
|
|
|
| Filter bandwidth usage by physical network port |
|
|
|
| Monitor network parameters other than bandwidth usage |
|
|
|
| CPU load on the machine running PRTG | Low | Higher, depends on the | Higher, depends on the |
| Excess bandwidth usage of monitoring | Small | None (except when monitoring | Depends on the traffic |
Steve Coppin, Oxford University
“I particularly like having breakfast at home and just surveying my domain, and understanding what's working and what isn't.”
Trusted by 500,000 users and recognized
by industry analysts as a leader

“Fantastic network and infrastructure monitoring solution that is easy to deploy and easier still to use. Simply the best available.”

“Software is absolutely perfect, Support is superior. Meets all needs and requirements, this is a must have solution if you are needing any form of monitoring.”

“The tool excels at its primary focus of being a unified infrastructure management and network monitoring service.”
PRTG makes your job easier
Our monitoring software frees you to focus on other tasks by promptly notifying you of potential issues.
![]()
Save effort
PRTG gives you one central monitoring tool for your servers and entire network. Enjoy a quick overview of your whole infrastructure via our dashboard and app.
![]()
Save time
Getting started with PRTG is a breeze. Setting up or switching from another network monitoring tool is easy thanks to the auto-discovery and pre-configured device templates.
![]()
Save money
80% of our customers report substantial cost savings with network monitoring. Your costs of licenses will likely pay for themselves within weeks.
“Easy to implement and configure with good technical support.”
R. v. S., ICT Manager at Heinen & Hopman Eng BV


PRTG: The multi-tool for sysadmins
Adapt PRTG individually and dynamically to your needs and rely on a strong API:- HTTP API: Access monitoring data and manipulate monitoring objects via HTTP requests
- Custom sensors: Create your own PRTG sensors for customized monitoring
- Custom notifications: Create your own notifications and send action triggers to external systems
- REST Custom sensor: Monitor almost everything that provides data in XML or JSON format
Still not convinced?
![]()
More than 500,000 sysadmins love PRTG
Paessler PRTG is used by companies of all sizes. Sysadmins love PRTG because it makes their job a whole lot easier.
Still not convinced?
![]()
Monitor your entire IT infrastructure
Bandwidth, servers, virtual environments, websites, VoIP services – PRTG keeps an eye on your entire network.
![]()
Try Paessler PRTG for free
Everyone has different monitoring needs. That’s why we let you try PRTG for free. Start now with your trial.
|
PRTG |
Network Monitoring Software - Version 24.2.94.1400 (April 10th, 2024) |
|
Hosting |
Download for Windows and cloud-based version PRTG Hosted Monitor available |
Languages |
English, German, Spanish, French, Portuguese, Dutch, Russian, Japanese, and Simplified Chinese |
Pricing |
Up to 100 sensors for free (Price List) |
Unified Monitoring |
Network devices, bandwidth, servers, applications, virtual environments, remote systems, IoT, and more |
Supported Vendors & Applications |
|