![]()
Go beyond latency tests to network latency monitoring with PRTG
- Keep a constant eye on quality of service, including latency
- Be promptly alerted in the event of latency spikes
- Take action immediately to preserve network stability
- Put an end to choppy connections – plus get full network monitoring
Our users give top ratings for monitoring with Paessler PRTG


PRTG network latency monitoring: What you’ll find on this page

PRTG makes monitoring network latency easy
Custom alerts and data visualization make it easy to monitor, identify, and prevent latency and other QoS issues.
Why choose PRTG as your network latency monitoring tool?
Faster than ITU-T latency recommendations
The telecommunication standardization sector of the International Telecommunication Union (ITU-T) provides many recommendations with regard to quality of service. When it comes to latency, the ITU-T recommends that delays be no more than 125 milliseconds.
We have somewhat stricter requirements than the ITU-T, for we recommend a maximum latency of 100 milliseconds.
The reason: with a lower latency threshold value, you can be notified in due time and intervene before your coworkers notice that something is awry.
Perpetual latency monitoring around the clock
Our Paessler PRTG latency monitoring software simultaneously monitors your servers, routers, and switches. It keeps a constant eye on all your QoS parameters. Latency, packet loss, jitter, and the mean opinion score are monitored 24/7/365.
If something goes wrong, you’ll be notified at once so you can immediately recognize and solve the causes of latency issues or other network problems.
PRTG even lets you create reports and gives you the opportunity to compare data over long periods of time.
Improved performance with network monitoring
PRTG’s more than 250 preconfigured sensors make it quick and easy to set up your network monitoring – including QoS monitoring and the crucial parameters that go with it.
During installation, PRTG runs its Auto-Discovery feature and automatically creates sensors within your IP address range.
With the free trial of PRTG, you can try all the software’s features with no risk. The free trial version is perfect for getting a feel for PRTG, no strings attached.
Trusted by 500,000 system administrators
PRTG is a product of Paessler AG, whose headquarters are in Nuremberg, Germany. Paessler AG has been a respected leader in monitoring solutions for over 20 years.
PRTG is our brainchild, and at the core of our daily work. More than 500,000 system administrators worldwide put their trust in PRTG – a software made in Germany.
Start network latency testing with PRTG and see how it can make your network more reliable and your job easier.
“All-around winning “The real beauty of PRTG is the endless possibilities it offers” “Outstanding cloud IT experts agree: Paessler PRTG is a great solution for IT infrastructure monitoring

network monitor”

monitoring”
What latency monitoring looks like in PRTG
Diagnose network issues by continuously monitoring and testing latency. Show latency speed test data in real time and visualize data in graphic maps & dashboards to identify problems more easily. Gain the visibility you need to troubleshoot slow network latency.

Device tree view of your entire monitoring setup
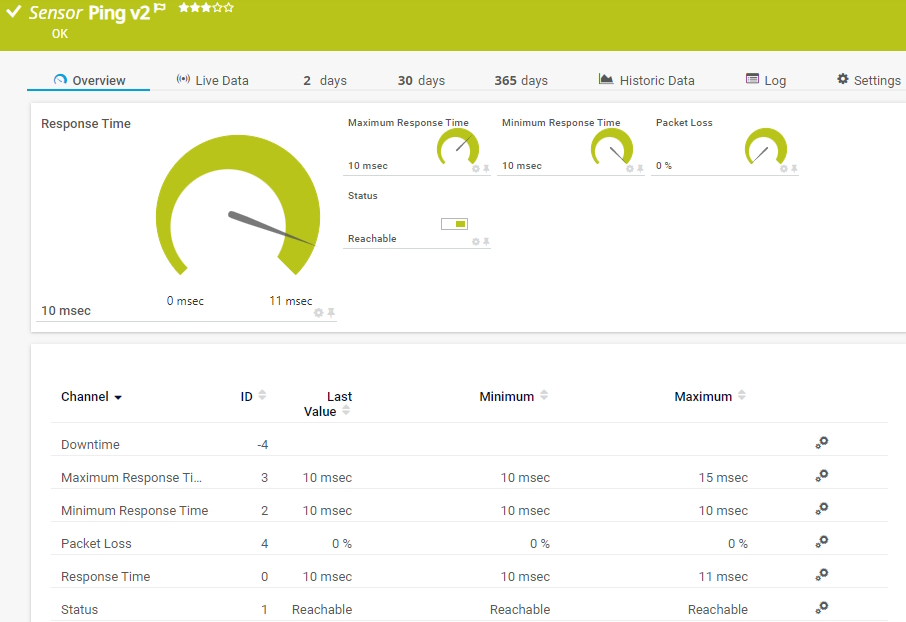
Ping v2 sensor in PRTG

Custom PRTG dashboard for a central overview of your IT infrastructure monitoring
Easily find the source of the problem with our PRTG latency monitoring solution
Real-time alerts and custom notifications make it easy to solve issues with latency spikes.
PRTG is compatible with all major vendors, products, and systems
![]()
5 tips to reduce network latency with PRTG
Monitor your routers and switches
All it takes is one faulty switch or router for latency to become a problem. PRTG lets you keep a constant eye on your hardware, especially the most important hubs.
This means you’ll spend less time getting to the root of a latency spike or some other network problem, and prevent emergencies before they happen.
Exploit the advantages of your LAN
Many companies use VoIP or video software such as Zoom. At the same time, more and more people are working on laptops.
Advise your coworkers to use the LAN (instead of the WLAN) for their video conferences, and take advantage of it to optimize the latency and round-trip times of your data.
Upgrade your hardware
If your company has outdated hardware that slows down the network, PRTG will immediately point out these weaknesses. PRTG includes visual charts and reports perfect for convincing management of the urgency of the situation.
When choosing a manufacturer for your upgrade, be sure to compare their latency in switches and routers.
Optimize routing across the network
Optimize your routing to allow data packets to travel across fewer routers and switches.
Our PRTG network latency monitoring tool counts and monitors the hops that data packets need to travel from one computer to another. You can also perform a traceroute on a specific device with just a click.
Prioritize individual applications
If certain applications are more important to your company than others (or are used more frequently), then it might make sense to prioritize them.
For example, if you do not care that emails take a few extra seconds to arrive, you can prioritize the data of other applications over your email.
Your network latency monitor at a glance – even on the go
Set up PRTG in minutes and use it on almost any mobile device.


PRTG makes monitoring network latency easy
Custom alerts and data visualization make it easy to monitor, identify, and prevent latency and other QoS issues.
“Excellent tool for detailed monitoring. Alarms and notifications work greatly. Equipment addition is straight forward and server initial setup is very easy. ...feel safe to purchase it if you intend to monitor a large networking landscape.”
Infrastructure and Operations Engineer in the Communications Industry, firm size 10B - 30B USD
Monitor QoS, latency, and ping times with these 3 sensors
QoS (Quality of Service) Round Trip sensor
PRTG comes with several QoS sensors. These include the QoS (Quality of Service) Round Trip sensor, which measures the quality of service along an entire route.
Cisco IP SLA sensor
Many Cisco devices gather their own QoS values. The Cisco IP SLA sensor reads these values and adds them to your centralized monitoring statistics.
Ping v2 sensor
The Ping v2 sensor checks the availability of your devices and the ping latency, including minimum and maximum response time and packet loss.
Easily find the source of the problem with our PRTG latency monitoring solution
Real-time alerts and custom notifications make it easy to solve issues with latency spikes.
Create innovative solutions with Paessler’s partners
Partnering with innovative vendors, Paessler unleashes synergies to create
new and additional benefits for joined customers.


ScriptRunner
With ScriptRunner, Paessler integrates a powerful event automation platform into PRTG Network Monitor.
Monitor and test network latency: FAQ
1. What is network latency?
Latency is a measurement of the time it takes for a data packet to travel from one point to another. This time is referred to as latency, the round-trip time, or the packet processing time.
2. Why is monitoring and testing network latency important?
By keeping latency spikes to a minimum, you can improve the stability of your network. When latency is too high, problems with VoIP and video conferences are likely to arise. Furthermore, transmission errors can prevent images from loading. Such latency issues are sure to push the capacities of your IT department to the limit.
3. How do I measure network latency?
Do a one-time latency test and use a simple ping query to obtain a one-time calculation of latency. Latency (or the ping time) is equal to the amount of time the query needs to reach its target device. You can also enter a traceroute command into the command line to determine the number of hops.
One-time latency tests provide individual measurements. They can identify specific problems, but they are not useful for comparisons, analyses, or monitoring to maintain ongoing network stability. Thus, you should always choose to permanently monitor the latency in your entire network with a latency checker like PRTG.
4. What is WAN latency?
Data packets need a certain amount of time to travel from one device to another. This is also true for packets in distributed networks such as a WAN. If a WAN is overloaded, then delays or disruptions may arise. An overloaded WAN can also have a negative impact on the corresponding LAN.
5. What do packet delay and packet loss have to do with latency?
If latency spikes, then data packets are likely to be delayed. They are transmitted more slowly and therefore need longer to reach their destination. PRTG measures the processing time of data packets automatically.
Packet loss can quickly lead to complaints and IT service requests. This is usually due to the dramatic drop in the quality of VoIP or video calls. With packet loss, packets get lost on the way to their destination.
6. What is a sensor in PRTG?
In PRTG, “sensors” are the basic monitoring elements. One sensor usually monitors one measured value in your network, for example the traffic of a switch port, the CPU load of a server, or the free space on a disk drive.
On average, you need about 5-10 sensors per device or one sensor per switch port.
We asked: would you recommend PRTG?
Over 95% of our customers say yes!
Paessler AG conducted trials in over 600 IT departments worldwide to tune its network monitoring software closer to the needs of sysadmins.
The result of the survey: over 95% of the participants would recommend PRTG – or already have.


PRTG: The multi-tool for sysadmins
Adapt PRTG individually and dynamically to your needs and rely on a strong API:- HTTP API: Access monitoring data and manipulate monitoring objects via HTTP requests
- Custom sensors: Create your own PRTG sensors for customized monitoring
- Custom notifications: Create your own notifications and send action triggers to external systems
- REST Custom sensor: Monitor almost everything that provides data in XML or JSON format
Paessler PRTG is used by companies of all sizes. Sysadmins love PRTG because it makes their job a whole lot easier. Bandwidth, servers, virtual environments, websites, VoIP services – PRTG keeps an eye on your entire network. Everyone has different monitoring needs. That’s why we let you try PRTG for free.Still not convinced?
![]()
More than 500,000
sysadmins love PRTG![]()
Monitor your entire IT infrastructure
![]()
Try Paessler PRTG
for free
![]()
Start network latency testing with PRTG and see how it can make your network more reliable and your job easier.
|
PRTG |
Network Monitoring Software - Version 24.2.94.1400 (April 10th, 2024) |
|
Hosting |
Download for Windows and cloud-based version PRTG Hosted Monitor available |
Languages |
English, German, Spanish, French, Portuguese, Dutch, Russian, Japanese, and Simplified Chinese |
Pricing |
Up to 100 sensors for free (Price List) |
Unified Monitoring |
Network devices, bandwidth, servers, applications, virtual environments, remote systems, IoT, and more |
Supported Vendors & Applications |
|
Combining the broad monitoring feature set of PRTG with IP Fabric’s automated network assurance creates a new level of network visibility and reliability.