![]()
Network performance testing:
How PRTG can help

PRTG monitors the performance of your network
PRTG notifies you in the event of malfunctions
PRTG uses ping, SNMP, and Flow technologies
PRTG is a centralized IT monitoring tool
PRTG is free of charge in its basic version
Network Performance Test
What you’ll find on this page
- Speed vs. network performance
- Network performance testing: How PRTG can help – and when other tools are necessary
- Network performance tools: The advantages of PRTG
- Examples of network testing with PRTG
- How do I test my network? 3 questions on network performance
- Other network-related topics for system administrators
Speed vs. network performance: What do you want to test?
Home use: Internet speed
If you're looking for a quick and easy way to test the speed of your Internet, then go with an online tool such as fast.com. This tool is operated by none other than Netflix. Many Internet users run speed tests at home to view their megabits per second when their streaming service gets bogged down.
Business use: Network performance
IT administrators, on the other hand, are in a completely different situation. They need to know more about the performance of their network. For example, their servers, routers, and switches – or the website and specific applications. When malfunctions occur in the network, the company immediately suffers and support inquiries go through the roof.
For a smooth-running network: More than 500,000 system administrators worldwide use these PRTG sensors
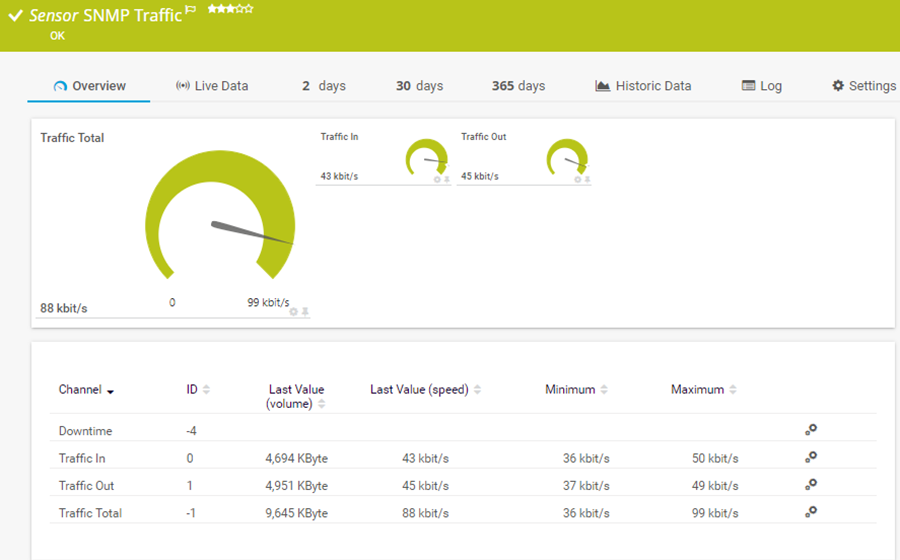
SNMP Traffic Sensor
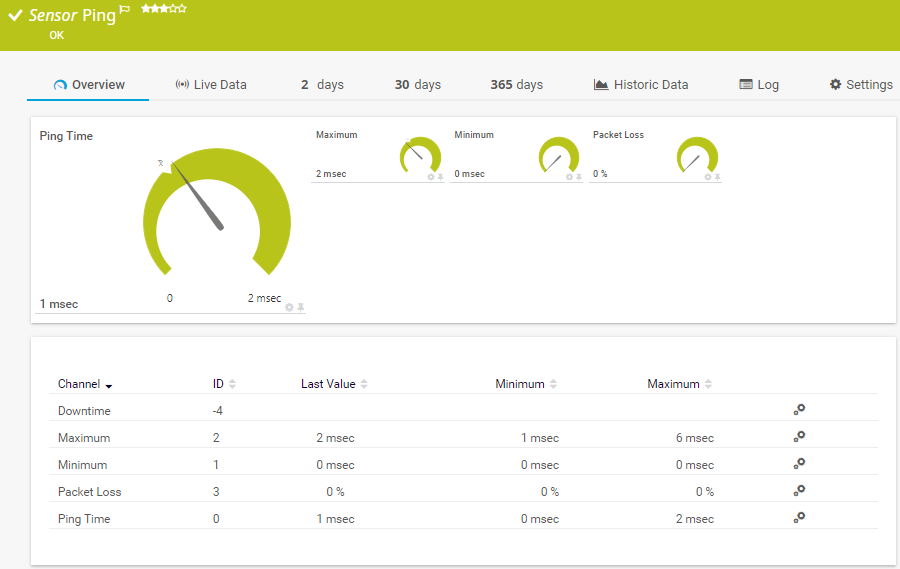
Ping Sensor
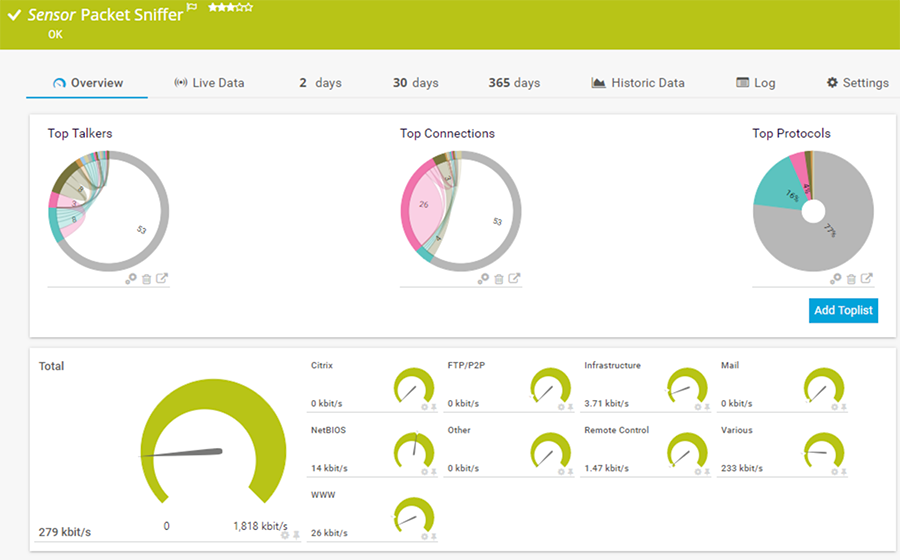
Packet Sniffing Sensor
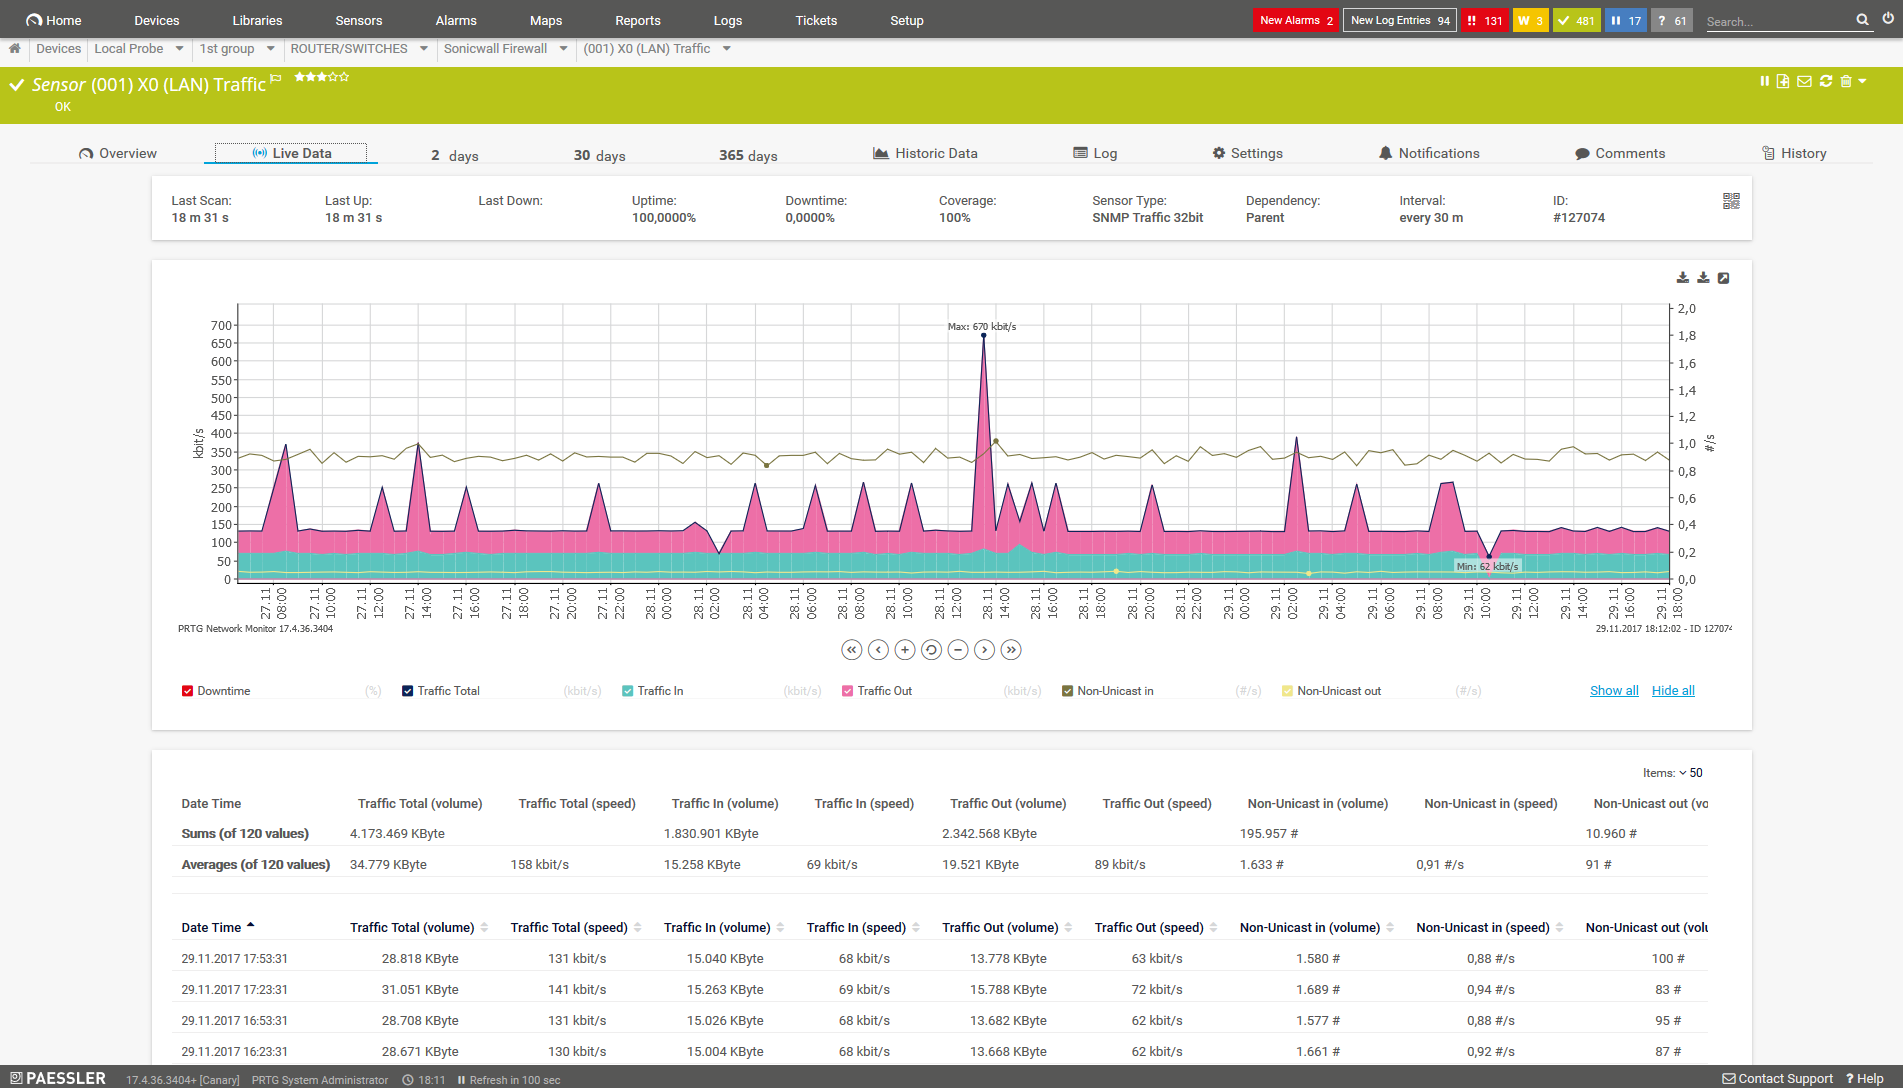
Live Traffic Sensor
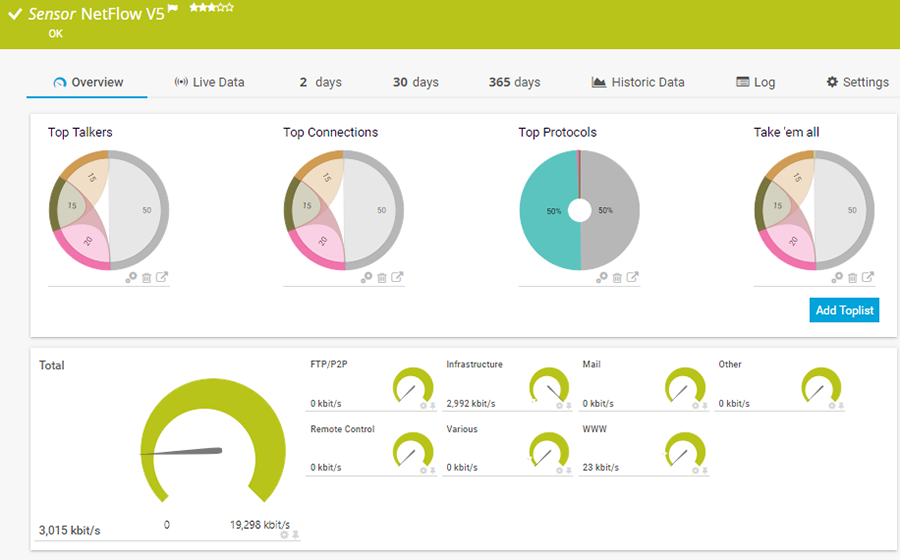
NetFlow Sensor
![]() How PRTG defines sensors
How PRTG defines sensors
In PRTG, “sensors” are the basic monitoring elements. One sensor usually monitors one measured value in your network, e.g. the traffic of a switch port, the CPU load of a server, the free space of a disk drive. On average you need about 5-10 sensors per device or one sensor per switch port.
Trusted by 500,000 users and recognized
by industry analysts as a leader

“Fantastic network and infrastructure monitoring solution that is easy to deploy and easier still to use. Simply the best available.”

“Software is absolutely perfect, Support is superior. Meets all needs and requirements, this is a must have solution if you are needing any form of monitoring.”

“The tool excels at its primary focus of being a unified infrastructure management and network monitoring service.”
Network performance testing: How PRTG can help – and when other tools are necessary
![]()
Network performance testing
PRTG is not your usual network performance testing tool. It won’t let you run a one-time test as you would via the command prompt (e.g. with ping). A one-time test is often of little use. With PRTG, you monitor your bandwidth continuously and receive an alert if a threshold value is exceeded.
![]()
Network performance monitoring
Upon installing PRTG, the Auto Discovery feature automatically checks the reachability of all the devices in a given IP range and incorporates these devices into your monitoring environment. You can then create sensors to keep a constant eye on specific values associated with your devices.
![]()
Network performance analysis
PRTG provides you with all the key performance data on bandwidth, devices, and applications. For more in-depth analysis of specific data packets, you’ll need a special data analysis tool.
Network performance tools: The advantages of PRTG
![]()
Centralized tool – for a quick and easy overview
With PRTG, you get one central monitoring tool for your entire IT infrastructure. Our software keeps a constant eye on hardware, traffic, and more. Sensors send all monitoring data to an easy-to-read dashboard.
![]()
Prompt alarm – for prompt reactions
If a malfunction occurs, our tool will notify you at once. All notification threshold values are customizable. You can therefore take action quickly – before the network goes down.
![]()
Compatible with all manufacturers – for greater ease of use
Our network tool is compatible with all the biggest manufacturers, including HP, Dell, Juniper, Cisco, and many more. With PRTG, you no longer need to monitor devices one-by-one but can keep an eye on the performance of your entire network from one central interface.
Examples of network testing with PRTG
![]()
Testing load times
PRTG continually monitors the load times of your website. This is especially useful if you do business abroad and your website is accessed by users worldwide. It’s not possible to set up a live load time test with PRTG. For more information, please see our page on website load tests.
![]()
Testing servers
PRTG is not a server performance testing tool per se, but it can be used to simulate a performance test. For example: write a script, let it run in short intervals with the help of a user-defined script sensor, then measure the corresponding hardware parameters.
More on server performance monitoring
![]()
Testing bandwidth
Testing for maximum bandwidth would cause your network to freeze up. No administrator wants that. Instead, test your bandwidth by generating small and short spikes in the load. For example: download a file every few minutes and simultaneously measure your bandwidth.
More on bandwidth
Quickly see if PRTG is working – even while on the go
Set up PRTG in minutes and use it on almost any mobile device.


Practical tip: “Hey Mathias, what would you tell administrators who wish to monitor their bandwidth?”
“Instead of trying to measure bandwidth by way of an extra, simulated load, you should have a look around for actions which do that anyway – and then monitor them. For example, when you perform backups, you often put great strain on the bandwidth and can thus easily recognize shortages or bottlenecks.”
Mathias Hengl, PRTG developer at Paessler AG
How do I test my network? 3 questions on network performance
How can I test and monitor my Windows devices?
PRTG runs on Windows. Its sensors use the Windows technology WMI (Windows Management Instrumentation) to monitor Windows devices. You can also use performance counters and Flow technologies as many networks contain devices from a variety of different manufacturers.
More on Windows monitoring
How can I test my jitter?
A high jitter value is often a good reason for a network performance test. You’ll need a suitable jitter tool to run a jitter test. A single delayed packet can lead to disruptions during a transmission. PRTG monitors the jitter in your network and immediately notifies you in the event of disruptions.
More on jitter
How do I monitor my Cloud services?
Virtual machines and Cloud applications are also prone to their fair share of errors. Individual tests won't tell you much. By keeping a constant eye on your network with a tool like PRTG, you can immediately see if Cloud applications are strained or about to crash. Learn more about Cloud monitoring sensors here.
Other network-related topics for system administrators
![]()
Network performance
With PRTG, you can monitor the performance of your entire network without having to run individual tests. All performance data is presented on an easy-to-read dashboard. Over 95% of our customers recommend PRTG.
![]()
LAN and WLAN monitoring
PRTG lets you check the status of your LAN and WLAN at a glance. It keeps an eye on all the activity in your network. Around the clock. Even in distributed networks.
More on LAN and WLAN/Wi-Fi monitoring
![]()
IP SLA monitoring
PRTG monitors quality of service in real time, regardless of the hardware in your network. Our software even monitors Cisco devices out of the box.
More on IP SLA monitoring


“Easy to implement and configure with good technical support.”
R. v. S., ICT Manager at Heinen & Hopman Eng BV

PRTG: The multi-tool for sysadmins
Adapt PRTG individually and dynamically to your needs and rely on a strong API:- HTTP API: Access monitoring data and manipulate monitoring objects via HTTP requests
- Custom sensors: Create your own PRTG sensors for customized monitoring
- Custom notifications: Create your own notifications and send action triggers to external systems
- REST Custom sensor: Monitor almost everything that provides data in XML or JSON format
Still not convinced?
![]()
More than 500,000 sysadmins love PRTG
Paessler PRTG is used by companies of all sizes. Sysadmins love PRTG because it makes their job a whole lot easier.
Still not convinced?
![]()
Monitor your entire IT infrastructure
Bandwidth, servers, virtual environments, websites, VoIP services – PRTG keeps an eye on your entire network.
![]()
Try Paessler PRTG for free
Everyone has different monitoring needs. That’s why we let you try PRTG for free. Start now with your trial.
|
PRTG |
Network Monitoring Software - Version 24.2.94.1400 (April 10th, 2024) |
|
Hosting |
Download for Windows and cloud-based version PRTG Hosted Monitor available |
Languages |
English, German, Spanish, French, Portuguese, Dutch, Russian, Japanese, and Simplified Chinese |
Pricing |
Up to 100 sensors for free (Price List) |
Unified Monitoring |
Network devices, bandwidth, servers, applications, virtual environments, remote systems, IoT, and more |
Supported Vendors & Applications |
|