![]()
Real-time monitoring: Improve
your network performance

PRTG monitors all your network components in real time
Keep a constant eye on servers, VMs, hardware,
and Cloud services
PRTG displays monitoring data on an easy-to-read dashboard
PRTG real-time monitoring helps you improve the performance of your network
Real-time monitoring with PRTG
Jump to the topic of your choice
- Why is real-time monitoring so important?
- How real-time monitoring with PRTG works
- Traffic monitoring: A comparison of WMI, SNMP, packet sniffing, and NetFlow
- Get a comprehensive look at your network – in real time
- Easy-to-read displays and user-defined maps
- Real-time notifications inform you of problems and errors as they happen
Why is real-time monitoring so important?
Optimize the performance and availability of your IT systems with real-time monitoring
![]()
Internet availability
Today, more than ever, companies rely on their Internet connection being always up and running. At the same time, they look to their network for functionality and performance. An ever increasing amount of goods and services are being purchased online. If one of your systems is down, it can not only impair business processes, but also affect sales. It is therefore vital that companies be informed immediately when malfunctions or performance snags arise.
![]()
Real-time monitoring with PRTG
By monitoring your network in real time, you’ll be sure to always know what is going on inside it. The PRTG Network Monitor captures all the traffic in your network, monitors the availability of servers, and measures key performance parameters such as bandwidth, CPU load, and the efficiency of virtual machines.
How real-time monitoring with PRTG works
The PRTG Real-Time Monitoring Tool uses all the best-known monitoring protocols to offer you data in real time. With PRTG, you can use SNMP, packet sniffing, and NetFlow to measure bandwidth consumption. SNMP is the most widely-used method, and provides an overview of all network traffic. You can also keep an eye on the data of individual ports. Another advantage: SNMP is extremely easy to configure. Learn more here.
Packet Sniffing is ideal for obtaining an in-depth analysis of your network traffic. It allows for traffic to be filtered by a variety of different values, such as IP addresses, protocols, or MAC addresses.
Flow-technologies such as NetFlow and IPFIX, jFlow and sFlow also offer extensive filtering possibilities – and compared to packet sniffing put less of a strain on your CPU. Which Flow protocol should you use? It all depends on the network device you want to monitor.
WMI is used for the real-time monitoring of Microsoft servers and workstations. With WMI, you get access to a variety of Windows-performance data, such as CPU load, memory capacity, and data traffic on the network interface card.
PRTG has a command of all these protocols, and arranges the data on easy-to-read dashboards.
Traffic monitoring: A comparison of WMI, SNMP, packet sniffing, and NetFlow
How would you like to implement your bandwidth monitoring? In addition to WMI, PRTG offers SNMP monitoring
and NetFlow-monitoring . Each of these options has its pros and cons. For a summary:
|
| WMI | SNMP | Packet Sniffer | Flow (IPFIX, NetFlow, sFlow, jFlow) |
|---|---|---|---|---|
| Setup | Medium | Easy | Easy to complex (depending on filter rules used) | Can be complex (e.g., the switch must be configured) |
| Traffic can be filtered |
|
|
| |
| Differentiate bandwidth usage by protocol or IPs |
|
|
|
|
| PRTG can show Toplists (Top Talker, Top Connections, Top Protocols, custom) |
|
|
|
|
| Filter bandwidth usage by IP |
|
|
|
|
| Filter bandwidth usage by MAC address |
|
|
|
|
| Filter bandwidth usage by physical network port |
|
|
|
|
| Monitor network parameters other than bandwidth usage |
|
|
|
|
| CPU load on the machine running PRTG | Medium | Low | Higher, depends on the amount of traffic | Higher, depends on the amount of traffic |
| Excess bandwidth usage of monitoring | Small | Small | None (except when monitoring switch ports are used) | Depends on the traffic |
Get a comprehensive look at your network – in real time
PRTG not only monitors bandwidth and network performance in real time,
but also provides precious insight into data recorded across the entire network.
![]()
Servers
PRTG lets you keep a constant eye on the vital data of all your servers, including status, health, and performance. Whether a mail-server, web server, or file server with the comprehensive real-time monitoring of all the key parameters, you’ll immediately know if you’ve run into a glitch.
PRTG helps you to avoid expensive downtime and ensure your servers perform at their peak.
![]()
Virtualization
At many companies, virtualization is a crucial part of the IT infrastructure. Virtualization allows for a more efficient use of resources, reduced energy costs, and the flexible distribution of available capacities.
PRTG lets you keep track of host servers and virtual machines, as well as all the operating systems and applications that are running on your VMs. You’ll recognize potential performance problems immediately, and can quickly intervene before customers or co-workers notice something is wrong and call you to complain.
![]()
Hardware
For a network to run smoothly, its hardware must be flawless. Thanks to PRTG, you no longer have to constantly worry about the status of your hardware. Real-time monitoring runs in the background and promptly notifies you if a problem arises – often before the network goes down completely.
![]()
Cloud
More and more business processes are being stored in the Cloud. PRTG offers a quick overview of several different Cloud services. Easy-to-read dashboards provide all the required information in real time, whether you use Amazon AWS, Microsoft OneDrive, Google Drive, or another Cloud storage service. You can set custom threshold values right in the software. If these values are exceeded, PRTG will automatically send you a message.
An introduction to real-time monitoring with PRTG
An easy-to-read PRTG display
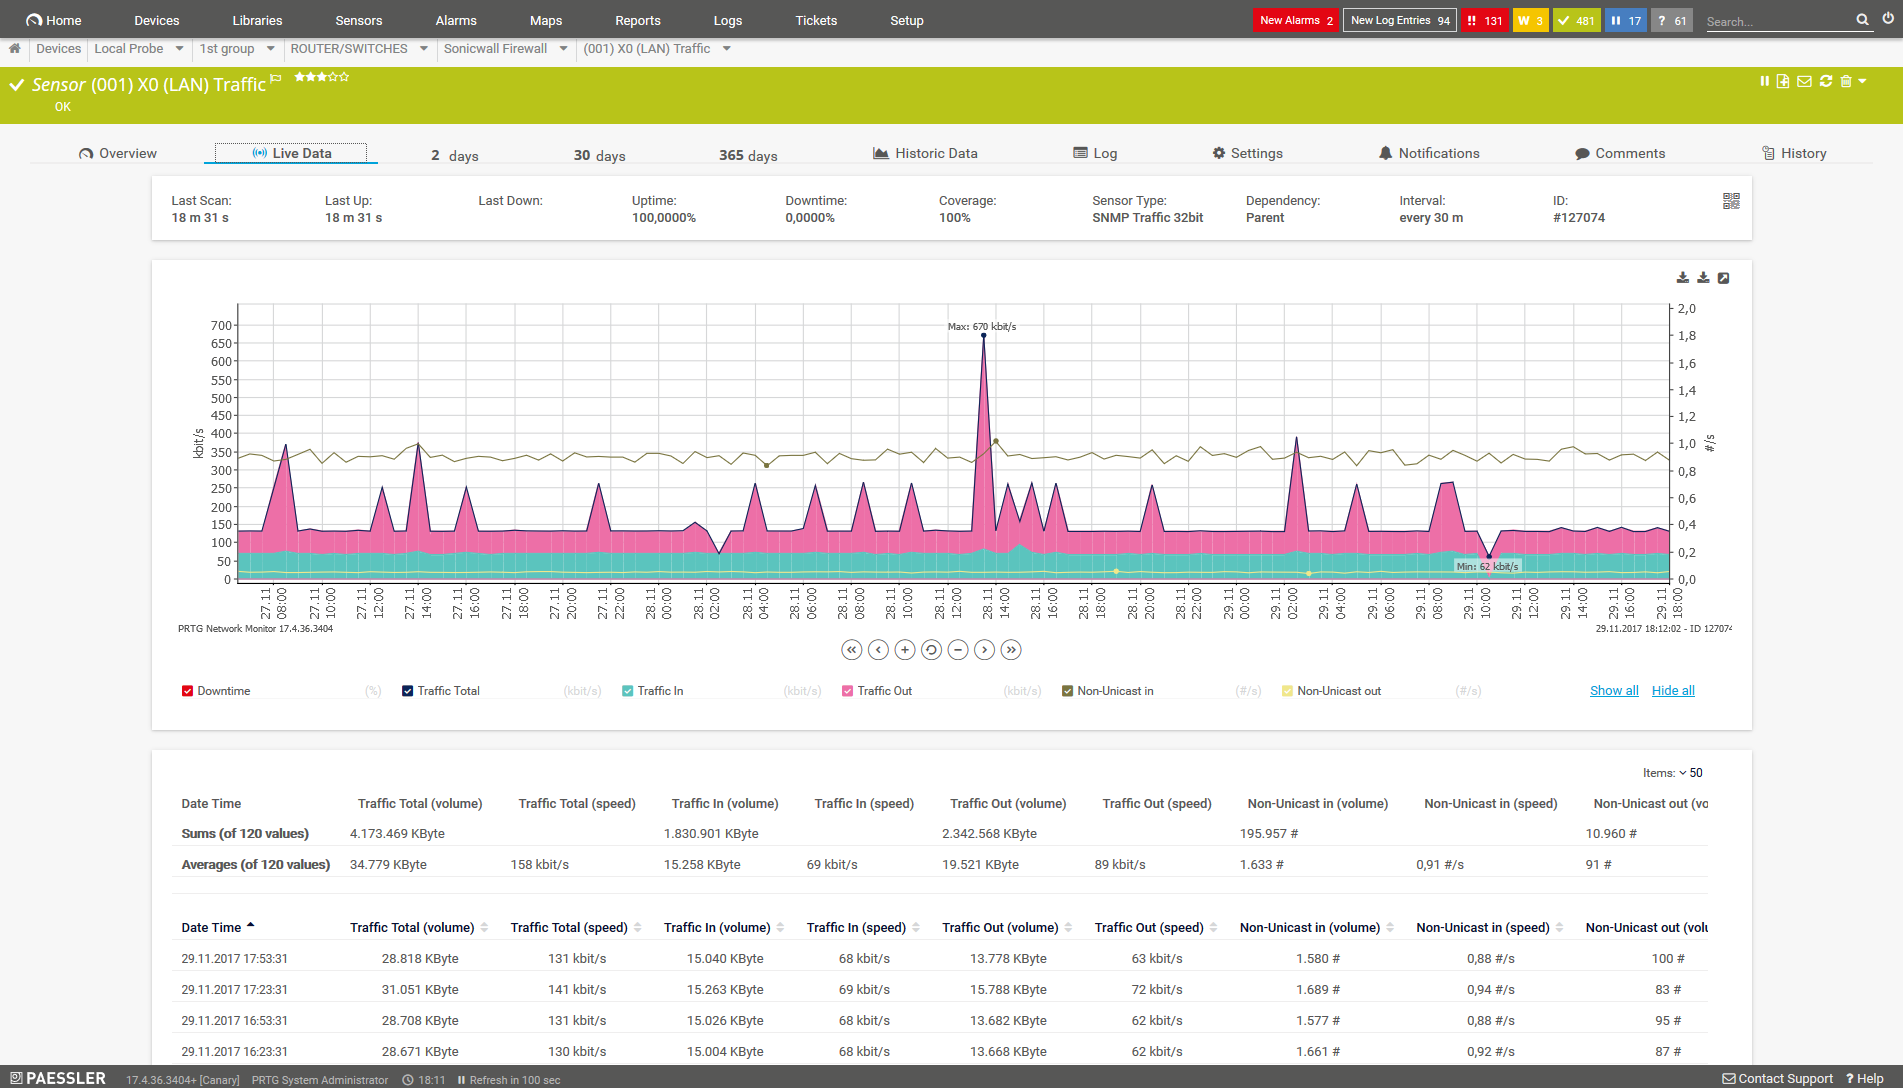
Traffic Live
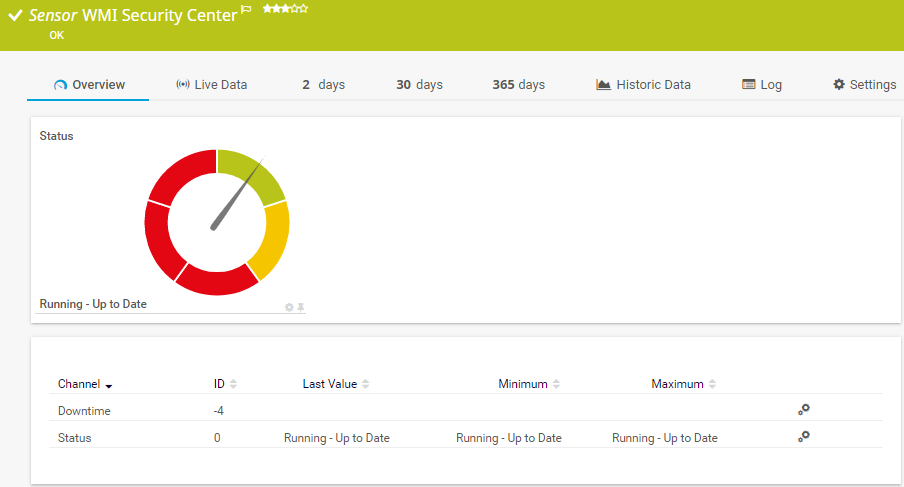
WMI Security Center Sensor
Easy-to-read displays and user-defined maps
![]()
Secure an overview
It’s easy to get lost in all the various network data and measurements – but not with PRTG! PRTG arranges even large amounts of monitoring data on easy-to-read dashboards, which means you can determine at a quick glance if (and which) network elements require your attention.
![]()
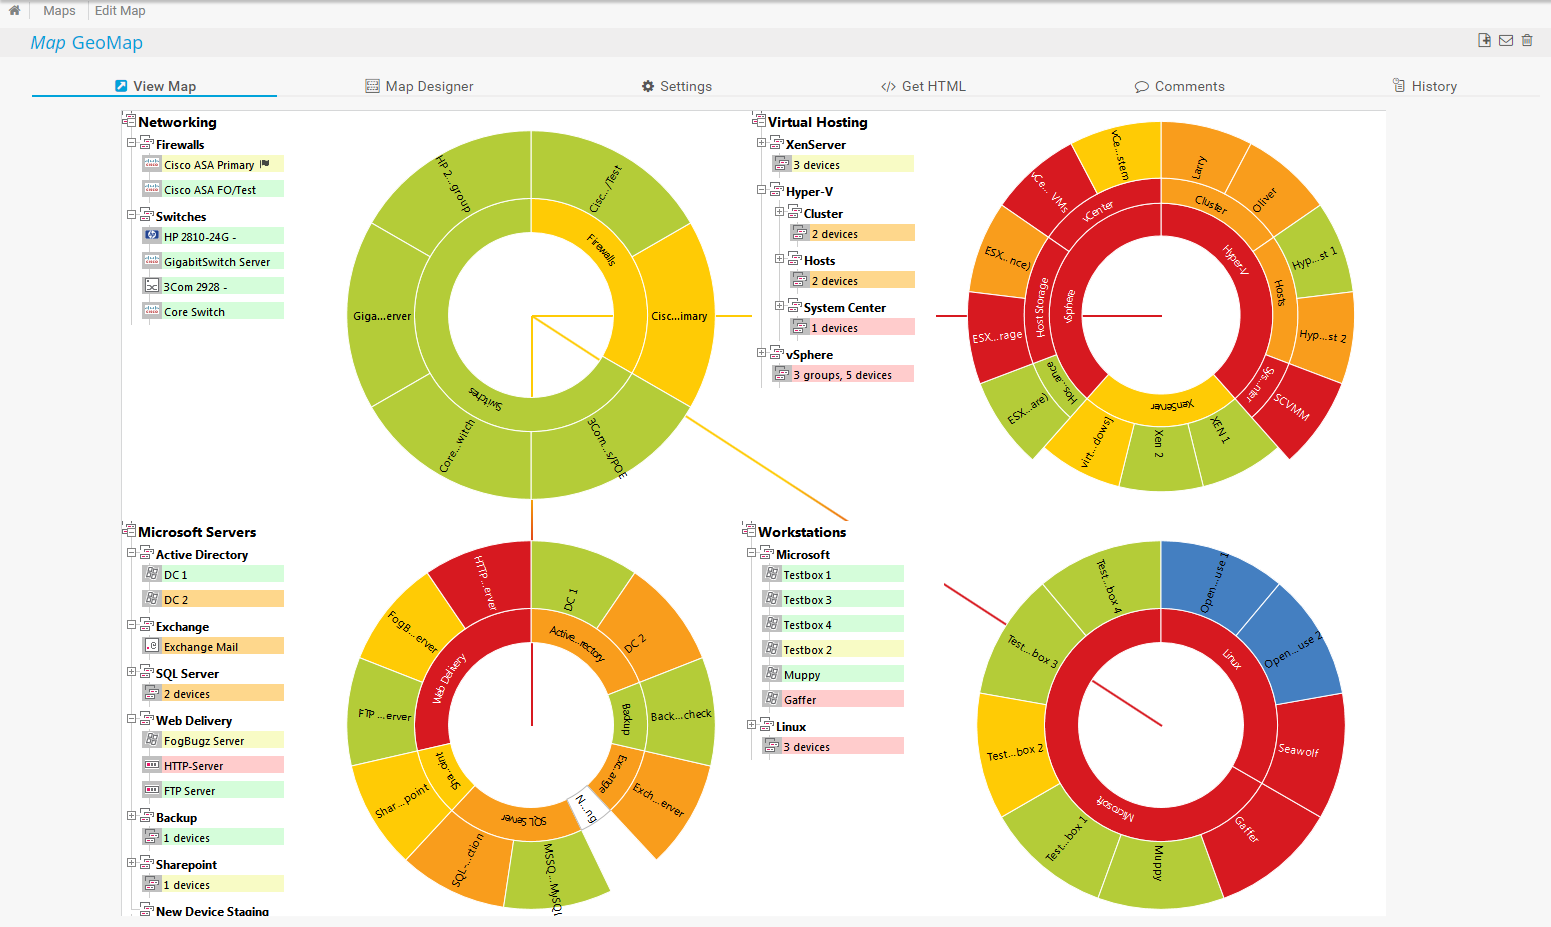
Map Designer
PRTG offers a variety of standard views, and also lets you create custom ones. Take advantage of the Map Designer to design sleek charts for your monitoring data on the fly, or create your own libraries and have the information displayed the way you need it.
We asked: would you recommend PRTG?
Over 95% of our customers say yes!
Paessler AG conducted trials in over 600 IT departments worldwide to tune its network monitoring software closer to the needs of sysadmins.
The result of the survey: over 95% of the participants would recommend PRTG – or already have.

Real-time notifications inform you of problems and errors as they happen
![]()
Network disruptions
If your website is down, your virtual machines are performing badly, or any other errors crop up in your network, you need to be told at once. PRTG’s customizable alarm system informs you promptly so you can quickly get to work on the problem. Choose to be notified by email, SMS, or push notification.
![]()
Alarm feature
Alarm thresholds can be set to any value whatsoever, which means that most of the time you can stamp out problems before things get serious. For example, you might receive a notification if your router returns an error message, even if the network has yet to experience a disruption. Thanks to PRTG, most errors can be fixed before your co-workers or customers get wind of them.
![]()
“We can all work with greater peace of mind knowing
that our systems are constantly being monitored.”
Markus Puke, Network Administrator, Schüchtermann Klinik, Germany
Trusted by 500,000 users and recognized
by industry analysts as a leader

“Fantastic network and infrastructure monitoring solution that is easy to deploy and easier still to use. Simply the best available.”

“Software is absolutely perfect, Support is superior. Meets all needs and requirements, this is a must have solution if you are needing any form of monitoring.”

“The tool excels at its primary focus of being a unified infrastructure management and network monitoring service.”
Monitor your network in real time – even while on the go
Set up PRTG in minutes and use it on almost any mobile device.


PRTG makes your job easier
Our monitoring software frees you to focus on other tasks by promptly notifying you of potential issues.
![]()
Save effort
PRTG gives you one central monitoring tool for your servers and entire network. Enjoy a quick overview of your whole infrastructure via our dashboard and app.
![]()
Save time
Getting started with PRTG is a breeze. Setting up or switching from another network monitoring tool is easy thanks to the auto-discovery and pre-configured device templates.
![]()
Save money
80% of our customers report substantial cost savings with network monitoring. Your costs of licenses will likely pay for themselves within weeks.

You want to know more about other network-related monitoring topics?
Here you find everything about...
PRTG as network traffic analyzer


“Easy to implement and configure with good technical support.”
R. v. S., ICT Manager at Heinen & Hopman Eng BV

PRTG: The multi-tool for sysadmins
Adapt PRTG individually and dynamically to your needs and rely on a strong API:- HTTP API: Access monitoring data and manipulate monitoring objects via HTTP requests
- Custom sensors: Create your own PRTG sensors for customized monitoring
- Custom notifications: Create your own notifications and send action triggers to external systems
- REST Custom sensor: Monitor almost everything that provides data in XML or JSON format
Still not convinced?
![]()
More than 500,000 sysadmins love PRTG
Paessler PRTG is used by companies of all sizes. Sysadmins love PRTG because it makes their job a whole lot easier.
Still not convinced?
![]()
Monitor your entire IT infrastructure
Bandwidth, servers, virtual environments, websites, VoIP services – PRTG keeps an eye on your entire network.
![]()
Try Paessler PRTG for free
Everyone has different monitoring needs. That’s why we let you try PRTG for free. Start now with your trial.
|
PRTG |
Network Monitoring Software - Version 24.2.94.1400 (April 10th, 2024) |
|
Hosting |
Download for Windows and cloud-based version PRTG Hosted Monitor available |
Languages |
English, German, Spanish, French, Portuguese, Dutch, Russian, Japanese, and Simplified Chinese |
Pricing |
Up to 100 sensors for free (Price List) |
Unified Monitoring |
Network devices, bandwidth, servers, applications, virtual environments, remote systems, IoT, and more |
Supported Vendors & Applications |
|