![]()
A constant eye on
server health with PRTG

Monitor server health
with PRTG
Get an in-depth overview
of the performance of servers, applications, and services
Create custom maps with
all the essential data regarding your servers
Take advantage of an
automatic alarm feature in the event of problems
Server health monitoring with PRTG
![]() A server is a computer or system that provides resources, data, services, or programs to other computers, known as clients, over a network. In theory, whenever computers share resources with client machines they are considered servers. There are many types of servers, including web servers, mail servers, and virtual servers.
A server is a computer or system that provides resources, data, services, or programs to other computers, known as clients, over a network. In theory, whenever computers share resources with client machines they are considered servers. There are many types of servers, including web servers, mail servers, and virtual servers.
Read more
What is server health monitoring?
Server health monitoring provides a comprehensive overview of the status and performance of individual servers. It also includes the monitoring of hardware parameters, external conditions in the server room, and various performance data of the servers and server racks. With a server health check, you can prevent downtime by keeping an eye on server elements such as CPU and memory use, fans, power supplies and consumption, the temperature of various components, and many other important gauges.
By monitoring server statuses, you can prevent costly crashes and ensure the optimal performance of all your servers.
Healthy servers are indispensable for your business
Most companies rely heavily on a stable IT infrastructure. As a result, downtime can lead to many serious problems. When servers are down, productivity takes a major hit as workers can no longer complete their tasks effectively, if at all. Depending on its duration, downtime can also cause significant losses in sales. This is especially true if sales and acquisitions take place via the company website. Customer satisfaction can also suffer if desired services are unavailable due to server problems.
Your servers at a glance – even on the go
Set up PRTG in minutes and use it on almost any mobile device.


3 good reasons to choose PRTG for your server health monitoring
![]()
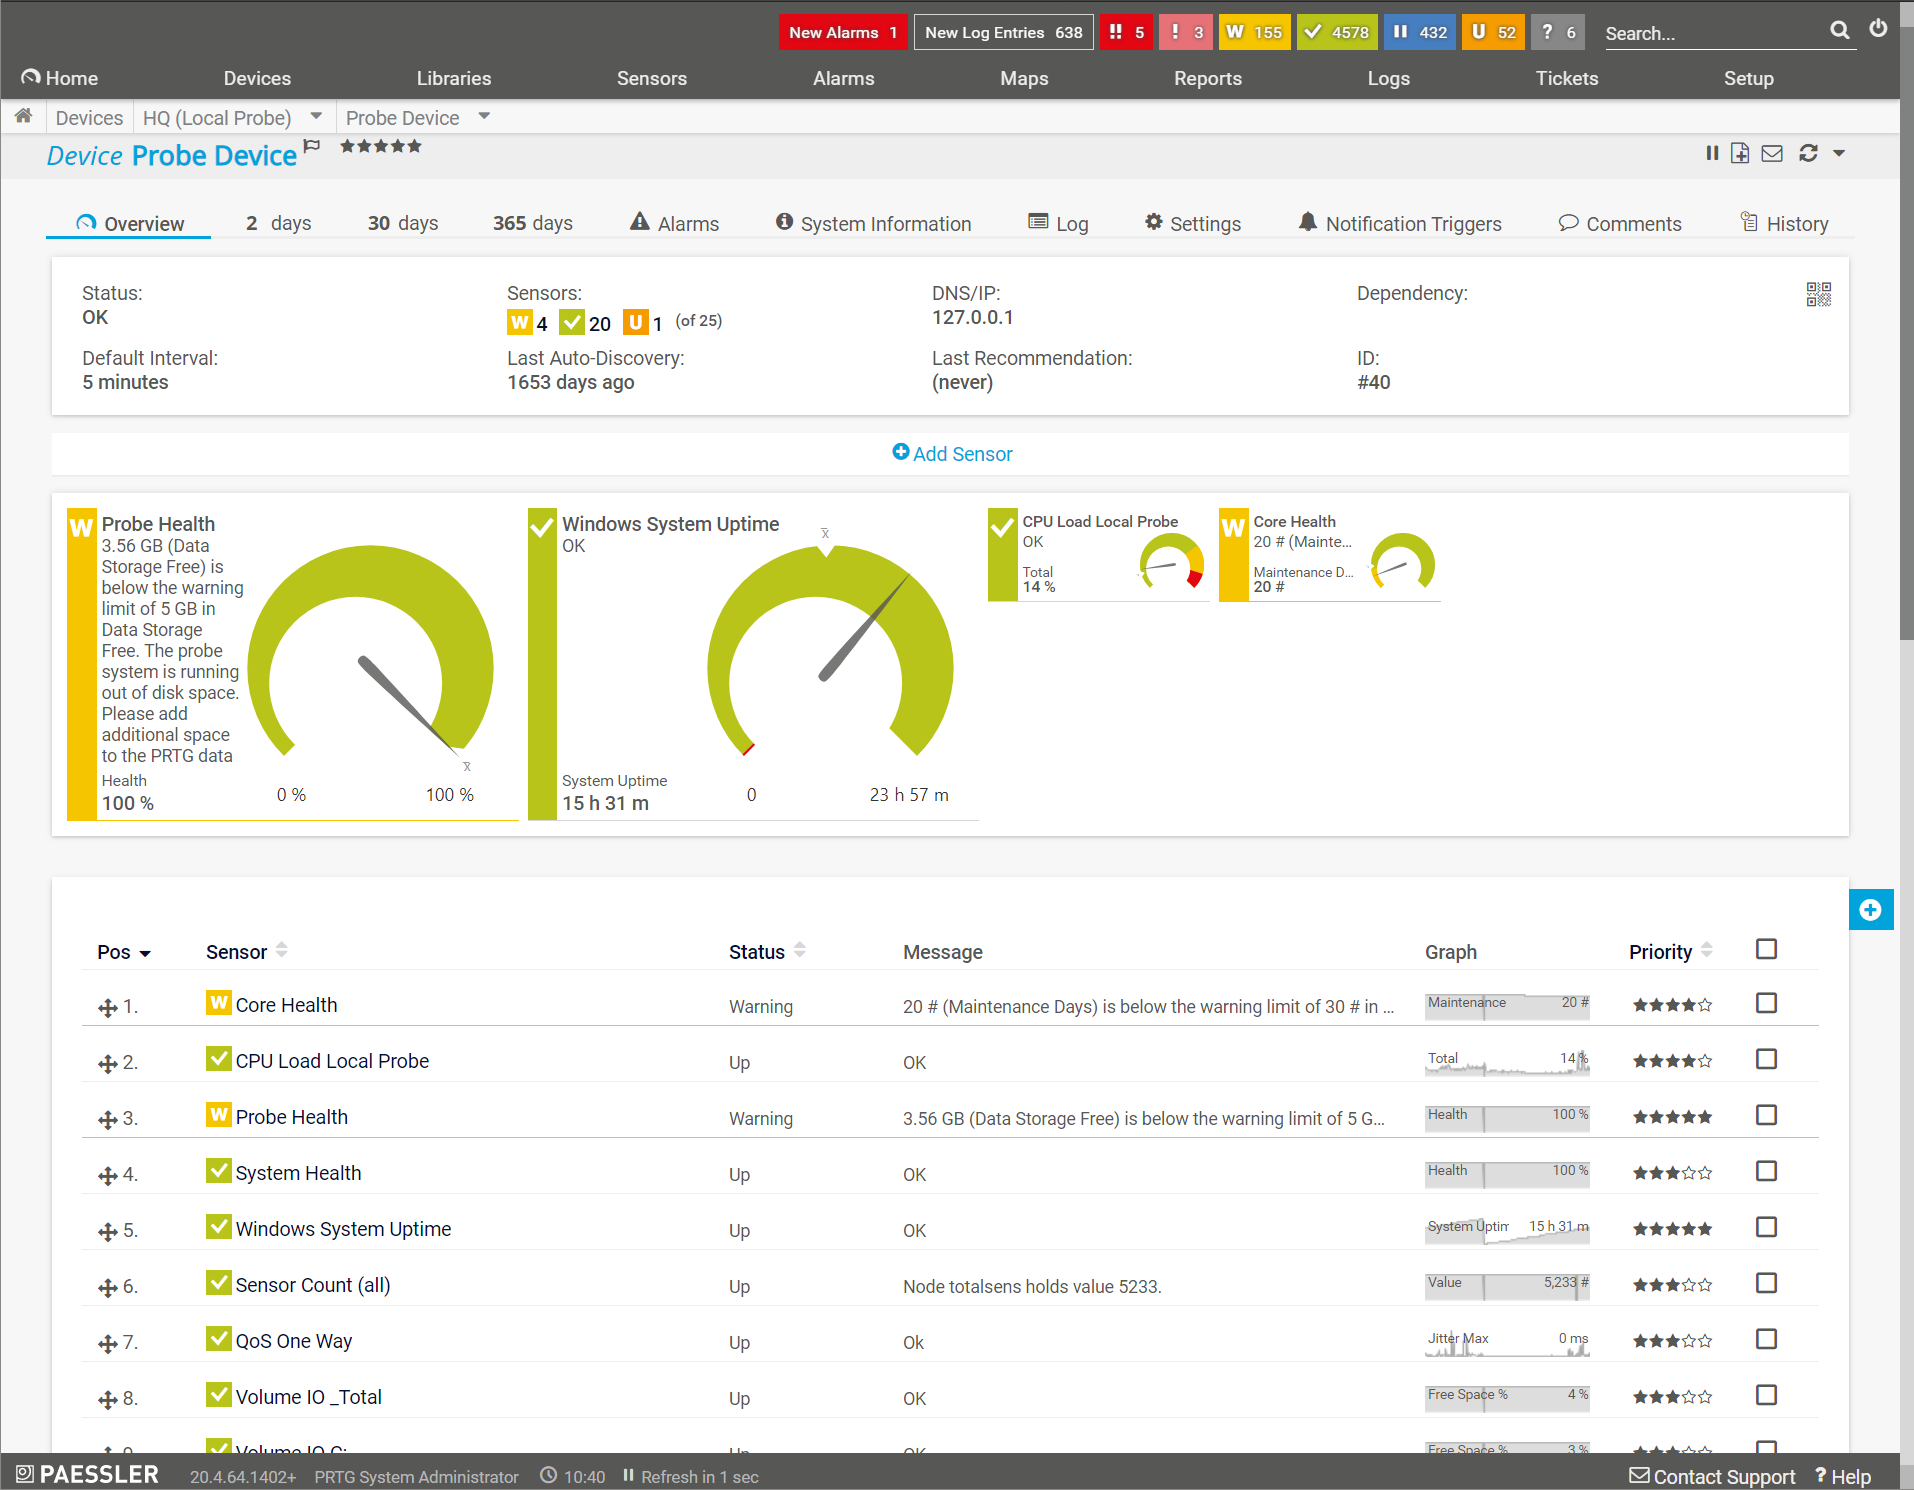
Comprehensive server monitoring
PRTG provides integral server status and performance monitoring by taking into account all the components that contribute to a healthy server infrastructure. In addition to individual services and applications, PRTG also keeps an eye on hardware components. To do so, it deploys preconfigured system health sensors that are suitable for a variety of different manufacturers. These sensors use SNMP to query relevant data for systems such as NetApp, Buffalo, Cisco, Dell, HP, IBM, Juniper, LenovoEMC, QNAP, SonicWall, and Synology. There are even health sensors for IPMI and SAN monitoring. PRTG also recognizes virtual VMware, Citrix, and Hyper-V servers, and incorporates them into its monitoring.
PRTG licenses come in all shapes and sizes and cater to your own individual needs – whether you wish to monitor a large server farm or just a few individual servers. And if your server room grows, upgrading to another license is both quick and easy.
![]()
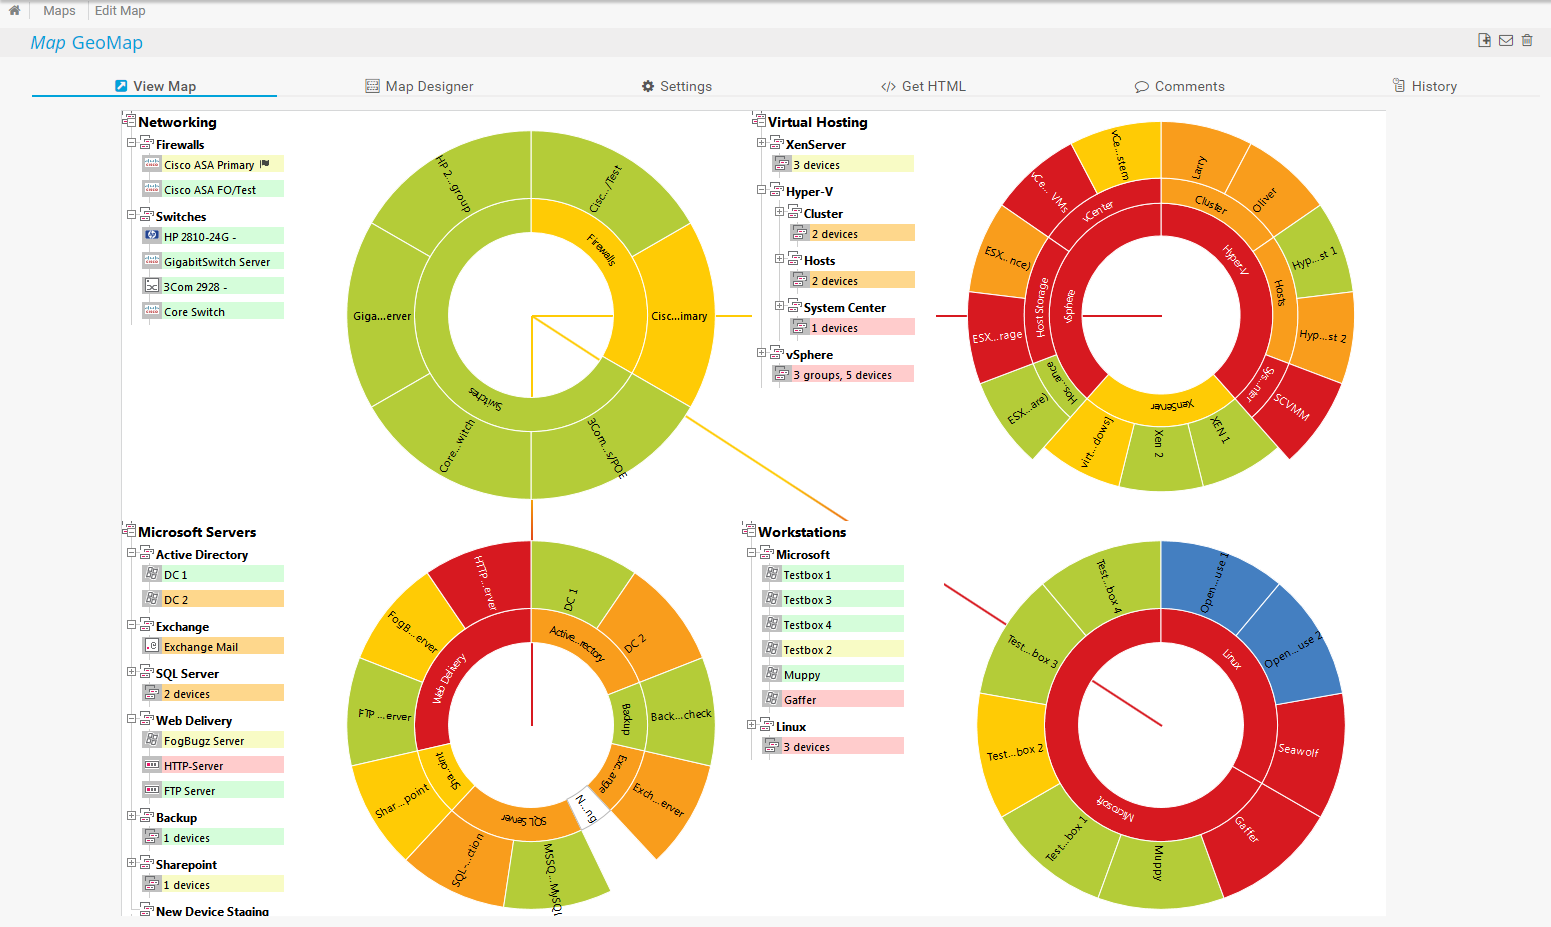
Customized dashboards and maps
The auto-discovery feature of PRTG captures your entire server infrastructure within seconds, and automatically detects any network devices that can be reached by ping.
![]() Ping is a command-line utility, available on virtually any operating system with network connectivity, that acts as a test to see if a networked device is reachable. The ping command sends a request over the network to a specific device. A successful ping results in a response from the computer that was pinged back to the originating computer.
Ping is a command-line utility, available on virtually any operating system with network connectivity, that acts as a test to see if a networked device is reachable. The ping command sends a request over the network to a specific device. A successful ping results in a response from the computer that was pinged back to the originating computer.
Read more
You can then use drag & drop to add individual objects and create an overview of all these components in easy-to-read maps.
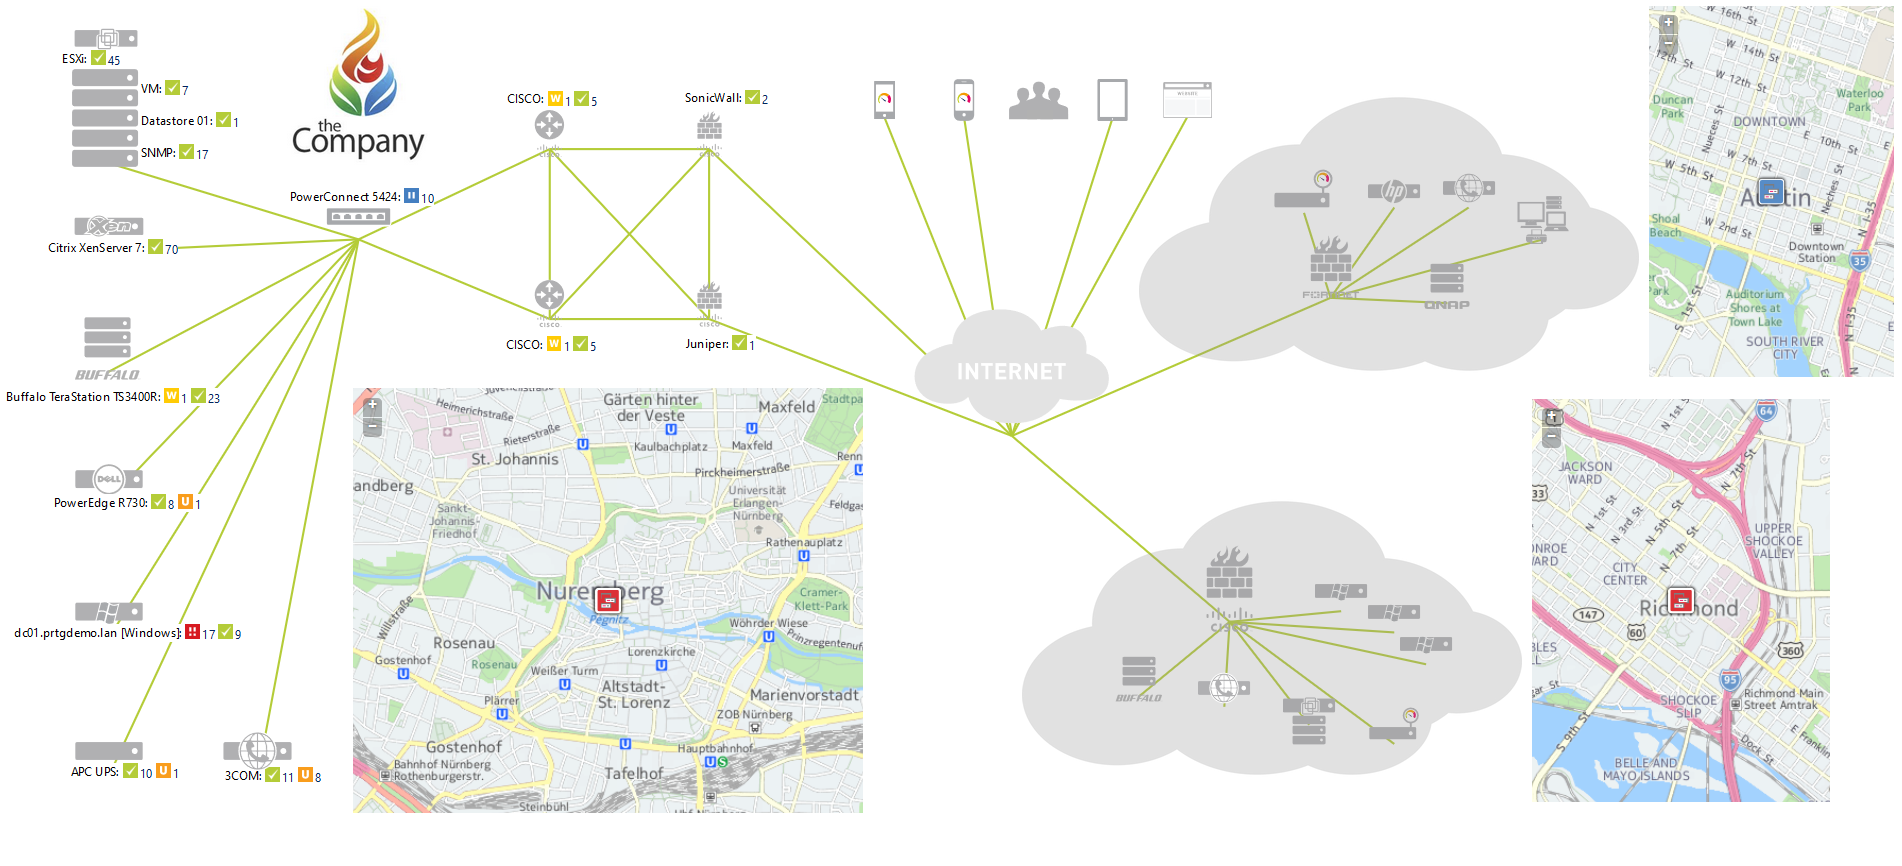
You can also opt for a predefined PRTG dashboard, such as the Sunburst View.
![]()
Prompt alarms allow for proactive troubleshooting
In the event that a server or your entire network is overstrained, PRTG will let you know at once – by email, SMS, or push notification. You can therefore intervene quickly and save your company from having to deal with potentially serious consequences. In addition, PRTG lets you customize notifications and define your own threshold values. If an error occurs and a server is no longer available or operational, PRTG will immediately sound the alarm via the chosen channel (email, SMS, or push notification) so you can minimize the negative effects that downtime incurs.
PRTG makes your job easier
Our monitoring software frees you to focus on other tasks by promptly notifying you of potential issues.
![]()
Save effort
PRTG gives you one central monitoring tool for your servers and entire network. Enjoy a quick overview of your whole infrastructure via our dashboard and app.
![]()
Save time
Getting started with PRTG is a breeze. Setting up or switching from another network monitoring tool is easy thanks to the auto-discovery and pre-configured device templates.
![]()
Save money
80% of our customers report substantial cost savings with network monitoring. Your costs of licenses will likely pay for themselves within weeks.

“Our network engineers really love PRTG, because of its customization”
John Krull, CTO, Oakland Unified School District, USA
Trusted by 500,000 users and recognized
by industry analysts as a leader

“Fantastic network and infrastructure monitoring solution that is easy to deploy and easier still to use. Simply the best available.”

“Software is absolutely perfect, Support is superior. Meets all needs and requirements, this is a must have solution if you are needing any form of monitoring.”

“The tool excels at its primary focus of being a unified infrastructure management and network monitoring service.”
All-in-one server health monitoring with PRTG
![]()
The status of server hardware
Peak performance is only reached when server hardware is up and running and error-free. PRTG’s Server Health Monitoring Tool lets you keep a constant eye on all your server hardware.
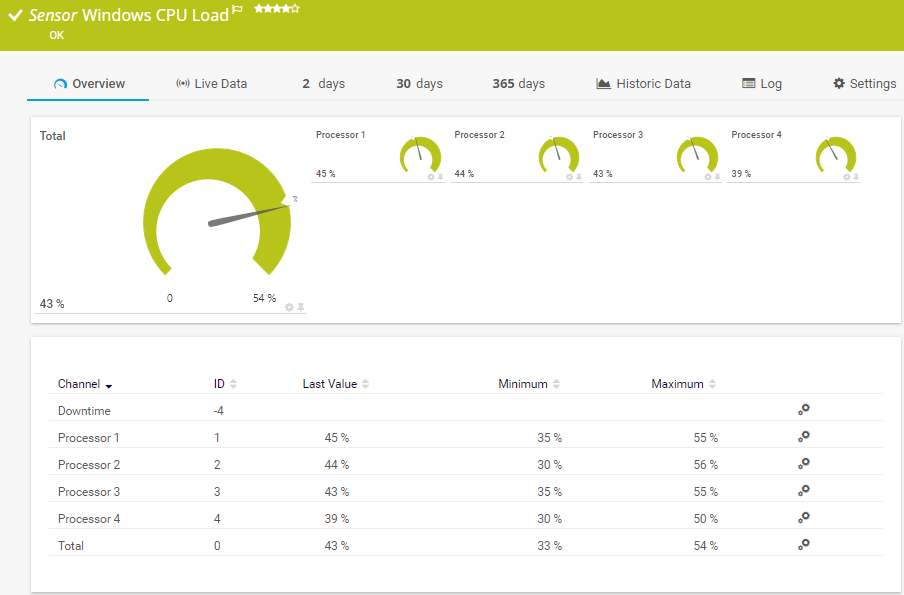
Server CPU
A key figure of each server is the CPU utilization. If this is in the red area for an extended period of time, there may be a significant loss in performance and response time. Another alarm signal is a permanently increased temperature of the server CPU. By monitoring the server CPU, you are immediately informed of critical overloads and can intervene in good time.
Memory and hard drives
In addition to the CPU, PRTG also monitors the memory of your servers and automatically notifies you when a certain threshold is exceeded. You can also quickly see if one of the disks should be replaced soon.
Other hardware components
PRTG also displays additional details such as fan status, temperature, or power supply. The information available about the server depends on the device being monitored.
![]()
Availability
Ideally, all your servers should be available around the clock. PRTG immediately sounds the alarm if one of your servers is down, allowing you to intervene in a flash. Individual stats display the availability of your servers over certain periods of time. As a result, you can quickly see how close your network is to 100% uptime.
![]()
Performance
In order for applications and services to run smoothly, strong server performance is a must. PRTG lets you monitor the capacity of your servers. It also shows you the impact of a server’s workload on your entire network.
Whether web server, mail server, file server, or database – with PRTG, you’ll maintain full control over the performance of your servers. PRTG’s predefined sensors make the monitoring of server performance a breeze.
A variety of performance variables (including bandwidth, availability, and response time) provide you with information on the performance of your server infrastructure.
![]()
Server room and environment
To ensure your servers run as smoothly as possible, you should also keep an eye on your server room. PRTG, when coupled with measuring devices for environmental monitoring (such as those which supply data via SNMP), can protect your equipment against damage caused by temperature fluctuations or humidity. PRTG lets you create your own threshold values and sounds the alarm whenever these are exceeded. A few clicks are all it takes to set the maximum temperature or humidity level, which, when reached, will prompt the sending of a notification by PRTG. By defining such threshold values, you’ll create optimal conditions for your servers. PRTG also comes with user-defined sensors which can monitor air conditioners, power supplies, and fire alarms if data on such devices is made available by your network.

„Hey Arne, how do I avoid false alarms during server maintenance?“
“In practice, repairs in the short-term will be necessary. While working, your monitoring will not trigger false alarms. The one-time maintenance window allows you to pause monitoring for each individual device or device group. For regular maintenance, with PRTG you can easily create an automated schedule.”
Arne Seifert, technical support at Paessler AG

“Easy to implement and configure with good technical support.”
R. v. S., ICT Manager at Heinen & Hopman Eng BV
Create innovative solutions with Paessler’s partners
Partnering with innovative vendors, Paessler unleashes synergies to create
new and additional benefits for joined customers.


UVnetworks
UVexplorer integrates tightly with PRTG to bring fast and accurate network discovery, detailed device inventory, and automatic network mapping to the PRTG platform.


PRTG: The multi-tool for sysadmins
Adapt PRTG individually and dynamically to your needs and rely on a strong API:- HTTP API: Access monitoring data and manipulate monitoring objects via HTTP requests
- Custom sensors: Create your own PRTG sensors for customized monitoring
- Custom notifications: Create your own notifications and send action triggers to external systems
- REST Custom sensor: Monitor almost everything that provides data in XML or JSON format
Still not convinced?
![]()
More than 500,000 sysadmins love PRTG
Paessler PRTG is used by companies of all sizes. Sysadmins love PRTG because it makes their job a whole lot easier.
Still not convinced?
![]()
Monitor your entire IT infrastructure
Bandwidth, servers, virtual environments, websites, VoIP services – PRTG keeps an eye on your entire network.
![]()
Try Paessler PRTG for free
Everyone has different monitoring needs. That’s why we let you try PRTG for free. Start now with your trial.
|
PRTG |
Network Monitoring Software - Version 24.2.94.1400 (April 10th, 2024) |
|
Hosting |
Download for Windows and cloud-based version PRTG Hosted Monitor available |
Languages |
English, German, Spanish, French, Portuguese, Dutch, Russian, Japanese, and Simplified Chinese |
Pricing |
Up to 100 sensors for free (Price List) |
Unified Monitoring |
Network devices, bandwidth, servers, applications, virtual environments, remote systems, IoT, and more |
Supported Vendors & Applications |
|
Combining the broad monitoring feature set of PRTG with IP Fabric’s automated network assurance creates a new level of network visibility and reliability.