![]()
Stop reacting and get proactive: Monitor via thresholds, with PRTG
- Detect potential issues before they affect your systems with quick source identification
- Reduce the need for constant manual monitoring with immediate threshold alerts
- Maintain peak system performance with informed upgrade and capacity planning
Our users give top ratings for monitoring with Paessler PRTG


PRTG threshold monitoring: What you’ll find on this page

PRTG makes monitoring using thresholds easy
Custom alerts and data visualization make it easy to monitor, identify, and prevent hardware, software, and IT infrastructure issues.
Take control of your network with PRTG’s user-defined threshold values
When you’re in data analytics, network management, or systems administration, you already know threshold alerts are time, money, and resource savers. Threshold monitoring with Paessler PRTG helps you gain even more control of your network and IT infrastructure, including devices, systems, traffic, and applications.
Monitor your network devices and actions
IT environments can be complex, and networks are no exception. Between routers, switches, firewalls, load balancers, and other network hardware, you can have several vendors, connections, and software. PRTG can monitor network traffic, performance, and errors via multiple technologies, providing a central reporting source for your network.
Watch your server performance metrics
If you have more than one type of server, you aren’t alone. You can struggle with monitoring all those metrics manually, or you can rely on PRTG threshold monitoring. From web, database, and file servers to mail and storage servers, PRTG will monitor your server performance and health, and alert you when your configured thresholds are reached.
Keep your virtual machines close
Virtual environments don’t have to feel a mile away – PRTG adds a virtualization layer to check your virtual machines. Monitor platforms like VMWare, Hyper-V, and Citrix Xen using individual warning and error thresholds. See the performance and status of your VMs, and get customized notifications sent to key stakeholders when issues arise.
Direct your bandwidth usage and data flow
Bandwidth is a finite resource for any organization, so finding, identifying, and troubleshooting bandwidth bottlenecks quickly is important for a healthy and efficient network. PRTG threshold alerts notify you before you reach maximum capacity, so you can allocate the resources in use differently or plan for new resources even before they’re needed.
Gauge your CPU temperature and performance
Always keep an eye on the most important hardware parameters. PRTG notifies you when the temperature of your CPU reaches the limits you’ve set. Also get alerts if early-stage bottlenecks appear, CPU usage soars, or the load is too high. Threshold monitoring with PRTG sends the notifications you need as soon as an issue appears so you can quickly find a solution.
What threshold monitoring looks like in PRTG
Diagnose network issues by continuously monitoring your hardware, applications, services, and more, using custom threshold values. Show performance and availability metrics in real time and visualize data in graphic maps & dashboards to identify problems more easily. Gain the visibility you need to troubleshoot network and infrastructure issues based on performance thresholds.

Device tree view of the complete monitoring setup
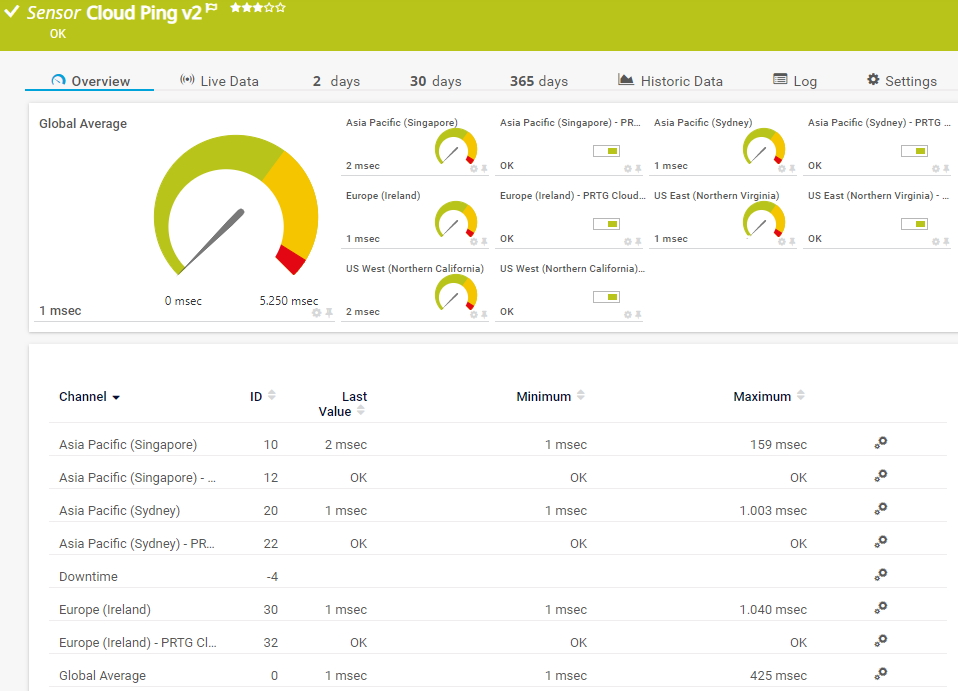
Cloud Ping v2 sensor in PRTG with predefined threshold values

Custom PRTG dashboard for keeping an eye on the entire IT infrastructure
Start threshold monitoring with PRTG and see how it can make your network more reliable and your job easier.
“All-around winning “The real beauty of PRTG is the endless possibilities it offers” “Outstanding cloud IT experts agree: Paessler PRTG is a great solution for IT infrastructure monitoring

network monitor”

monitoring”
3 reasons to choose PRTG as your threshold monitoring tool
Network management in God mode
PRTG gives you the power to monitor and manage your entire network and IT environment across servers, devices, vendors, and more.
PRTG can be fully integrated into your network or only monitor a single device. It’s up to you how many devices you monitor in your network. Customize PRTG to meet your own needs and requirements.
Threshold values for the best alert system
Don’t get bothered by unnecessary alerts. PRTG makes it easy to configure your threshold values to match the needs of your IT ecosystem.
Set your threshold alerts to higher sensitivity for critical devices adversely affected by minor deviations. Set them to lower sensitivities for systems and devices that have a higher performance variability, so you aren’t bothered by unnecessary alerts.
Easy-to-understand reports and visualization
View the status and health of your devices at a single glance. Using a simple traffic lights system for visualizing warnings (yellow), errors (red), and everything that’s running as expected (green), you can see immediately when an issue arises.
You can also create reports of capacities over time to recognize trends. PRTG reports are easy to understand and help you determine the capacity of your network at a glance.
To define or not to define threshold values in advance
Why define them in advance
If you define thresholds for the sensors you need in advance, it will take less time to set up monitoring and you avoid being flooded with unnecessary notifications.
Why not define them before
If you configure your monitoring setup without defining thresholds, you can fine-tune them easier according to your devices’ and networks’ specific requirements.
Why it depends sometimes
Sometimes custom configurations are unnecessary – at other times, they’re a must. With PRTG, threshold values are usually not defined in advance so you can set your own.
Your threshold monitor at a glance – even on the go
Set up PRTG in minutes and use it on almost any mobile device.


Easily find the source of the problem with our PRTG threshold monitoring solution
Real-time alerts and custom notifications make it easy to solve issues with your entire network.
PRTG is compatible with all major vendors, products, and systems
![]()
Create innovative solutions with Paessler’s partners
Partnering with innovative vendors, Paessler unleashes synergies to create
new and additional benefits for joined customers.


With ScriptRunner, Paessler integrates a powerful event automation platform into PRTG Network Monitor.
ScriptRunner
“Excellent tool for detailed monitoring. Alarms and notifications work greatly. Equipment addition is straight forward and server initial setup is very easy. ...feel safe to purchase it if you intend to monitor a large networking landscape.”
Infrastructure and Operations Engineer in the Communications Industry, firm size 10B - 30B USD
PRTG makes monitoring using thresholds easy
Custom alerts and data visualization make it easy to monitor, identify, and prevent hardware, software, and IT infrastructure issues.
Monitoring thresholds in PRTG: FAQ
What is threshold monitoring?
Threshold monitoring is a technique used in various fields, including computer science, finance, and environmental science. It involves setting predefined thresholds or limits for certain parameters or variables.
These thresholds act as benchmarks for normal operation or acceptable levels of a particular metric. When the observed value of the parameter exceeds or falls below the set threshold, an alert or action is triggered, indicating a potential issue or deviation from the expected behavior.
How does PRTG monitor thresholds?
PRTG uses sensors to monitor networks and IT environments. These sensors are preconfigured but customizable, so you can use the most common configurations or set individual threshold values to meet your needs. When a designated metric gets close to the threshold, PRTG sends an alert to the key stakeholder.
For example, the SNMP CPU Load sensor monitors your CPU performance. PRTG comes with preconfigured sensors for all the biggest manufacturers, including Cisco, IBM, Dell, and HPE. What’s more, all your CPU threshold values are customizable. PRTG will automatically (and promptly) send you an alert – before the system goes down.
What do the different thresholds in PRTG mean?
Different thresholds represent various states of performance, resource usage, or operational health. They help to distinguish between when things are operating normally and when there are potential issues. Thresholds in PRTG include:
- Error: set for the most critical conditions that require immediate intervention, such as those that significantly impact system performance.
- Warning: a metric is approaching critical but hasn’t reached a point of immediate concern. This is where threshold monitoring really makes itself shine, stopping issues here before they become critical.
How easy is it to configure threshold values in PRTG?
For many sensors, it only takes a few short minutes:
- Create the sensor in PRTG.
- Open the channel settings.
- Set the upper and lower “warning” and “error” limits and define the corresponding sensor messages.
- Save your settings.
- Your PRTG speedometer should now have a yellow section for warnings and a red section for errors.
What is a sensor in PRTG?
In PRTG, “sensors” are the basic monitoring elements. One sensor usually monitors one measured value in your network, for example the traffic of a switch port, the CPU load of a server, or the free space on a disk drive.
On average, you need about 5-10 sensors per device or one sensor per switch port.

PRTG: The multi-tool for sysadmins
Adapt PRTG individually and dynamically to your needs and rely on a strong API:- HTTP API: Access monitoring data and manipulate monitoring objects via HTTP requests
- Custom sensors: Create your own PRTG sensors for customized monitoring
- Custom notifications: Create your own notifications and send action triggers to external systems
- REST Custom sensor: Monitor almost everything that provides data in XML or JSON format
Paessler AG conducted trials in over 600 IT departments worldwide to tune its network monitoring software closer to the needs of sysadmins. We asked: would you recommend PRTG?
Over 95% of our customers say yes!
The result of the survey: over 95% of the participants would recommend PRTG – or already have.
Paessler PRTG is used by companies of all sizes. Sysadmins love PRTG because it makes their job a whole lot easier. Bandwidth, servers, virtual environments, websites, VoIP services – PRTG keeps an eye on your entire network. Everyone has different monitoring needs. That’s why we let you try PRTG for free.Still not convinced?
![]()
More than 500,000
sysadmins love PRTG![]()
Monitor your entire IT infrastructure
![]()
Try Paessler PRTG
for free
![]()
Start threshold monitoring with PRTG and see how it can make your network more reliable and your job easier.
|
PRTG |
Network Monitoring Software - Version 24.2.94.1424 (May 2nd, 2024) |
|
Hosting |
Download for Windows and cloud-based version PRTG Hosted Monitor available |
Languages |
English, German, Spanish, French, Portuguese, Dutch, Russian, Japanese, and Simplified Chinese |
Pricing |
Up to 100 sensors for free (Price List) |
Unified Monitoring |
Network devices, bandwidth, servers, applications, virtual environments, remote systems, IoT, and more |
Supported Vendors & Applications |
|