![]()
Keep your system running smoothly with real-time CPU load monitoring
- Improve system performance by identifying and addressing CPU usage and load
- Ensure critical applications get the processing power they need
- Record CPU usage over longer periods of time for better capacity planning
- Troubleshoot faster with a full diagnostic view of your computers & other hardware
Our users give top ratings for monitoring with Paessler PRTG


PRTG CPU load monitoring: What you’ll find on this page
PRTG makes it easy to monitor your CPU usage.
Custom alerts and data visualization make it easy to monitor, identify, and prevent system performance and stability issues.
Fine-tune your system for peak CPU performance & system reliability
CPU load monitoring is a critical aspect of IT management, but not just any monitoring will do. You need a CPU usage monitoring tool that supports you 24/7/365. Paessler PRTG provides round-the-clock, real-time monitoring on multiple devices, at the office, and on the go. Your systems perform better, and you get peace of mind.
Optimize your server performance
Balance the workload of your servers better with uniform load distribution. For servers, computers, and other processor-controlled hardware to be stable, CPU computing power has to be evenly distributed.
PRTG helps you monitor your overall processor load, as well as the loads of individual CPU cores.
Monitor your CPU
in real time
Set up warning and error thresholds to notify you in the case of abnormal CPU usage patterns.
Real-time, always-on CPU load monitoring makes sure that you’ll be alerted before the situation reaches critical, allowing you to quickly identify performance bottlenecks, prevent system overloads, and maintain an efficient IT infrastructure.
Accurately plan for capacity upgrades
Analyze historical CPU usage data so you can understand trends and make informed decisions about capacity upgrades.
While reviewing this data can be complex, PRTG simplifies this process with a central dashboard and easy-to-understand visual graphs for 2-day, 30-day, and 365-day historical data analysis.
Prevent downtime for business continuity
Reduce the risk of downtime during peak usage periods with the visibility and control you need over your IT systems.
PRTG CPU load monitoring helps you identify malfunctioning or slow processes and critical CPU usage, optimize load balancing, speed, and performance, and get notified before a CPU reaches overload.
Start monitoring your CPU usage with PRTG and see how it can make your network more reliable and your job easier.
“All-around winning “The real beauty of PRTG is the endless possibilities it offers” “Outstanding cloud IT experts agree: Paessler PRTG is a great solution for IT infrastructure monitoring

network monitor”

monitoring”
What CPU load monitoring looks like in PRTG
Diagnose network issues by continuously monitoring the usage of your CPU. Show CPU load, CPU temperature, and more in real time and visualize data in graphic maps & dashboards to identify problems more easily. Gain the visibility you need to troubleshoot your hardware performance.

Device tree view of the entire monitoring setup
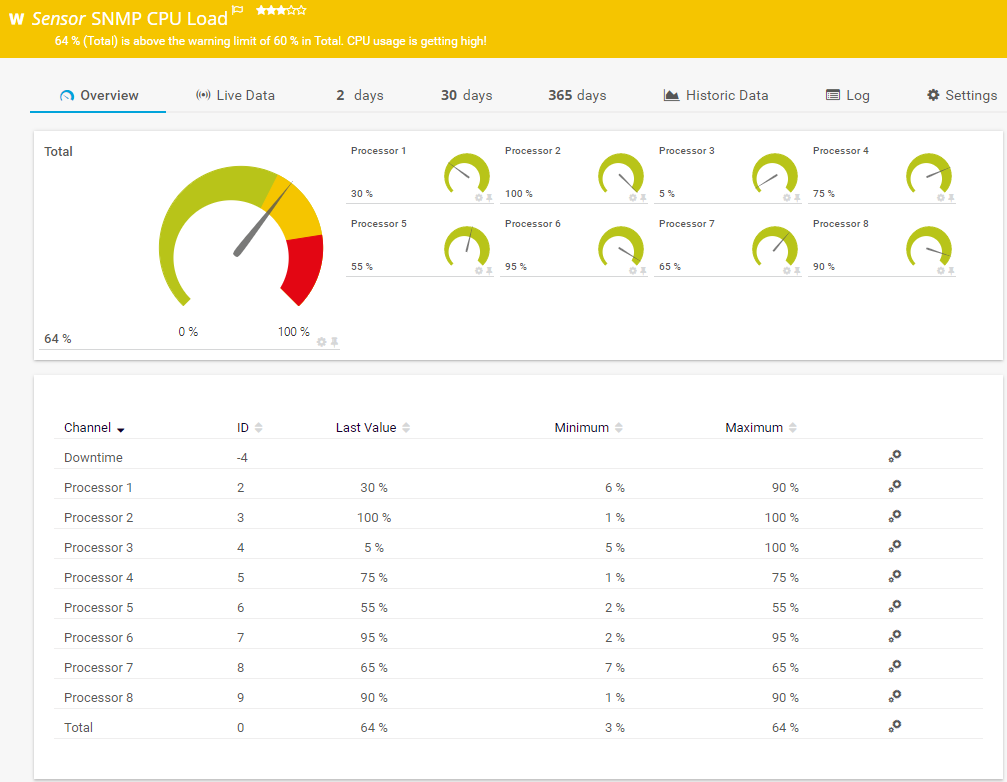
SNMP CPU Load sensor in warning status
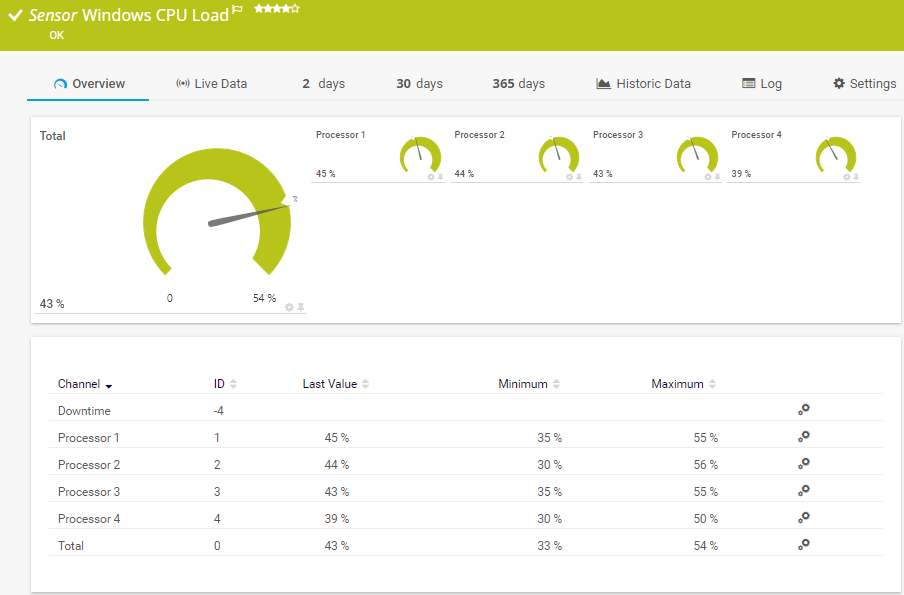
Windows CPU Load sensor
PRTG is compatible with all major vendors, products, and systems
![]()
5 reasons to choose PRTG as your CPU load monitor
Customize your alerts
Set your alerts to be as sensitive as you need them to be. With PRTG, you can define custom notification triggers based on specific CPU load thresholds so you can make upgrades and fix capacity concerns before they’re an actual issue.
Get immediate notifications
PRTG CPU load monitoring will show you exactly where the load is distributed and how much is placed on your servers. If the values get too high, PRTG will automatically send you an alarm via SMS, email, push notification, and more when the defined percentage is reached.
Maintain an overview
Display your CPU load info on a single, customizable dashboard. PRTG lets you prepare your long-term CPU load data in accordance with your own individual needs, and automated reports in HTML, PDF, CSV, or XML format keep your coworkers and higher-ups in the know.
Monitor from anywhere
Our PRTG apps for iOS or Android make CPU load monitoring travel-friendly. Remotely monitor your entire IT infrastructure, computers, server hardware, and network security on your phone, desktop, or laptop. If you have internet access, you have access to your CPU data.
Monitor everything
The all-in-one monitoring solution PRTG provides server and application monitoring, bandwidth monitoring, and much more in a single tool. This integrated approach gives you a comprehensive view of your entire network, including system health and network traffic analysis.
Easily find the source of the problem with our PRTG CPU load monitoring solution
Real-time alerts and custom notifications make it easy to solve issues with hardware performance and health.
Your CPU usage meter at a glance – even on the go
Set up PRTG in minutes and use it on almost any mobile device.


Create innovative solutions with Paessler’s partners
Partnering with innovative vendors, Paessler unleashes synergies to create
new and additional benefits for joined customers.


INSYS icom
With the combination of PRTG and Insys, the monitoring specialist Paessler and the industrial gateway manufacturer INSYS icom offer a practical possibility to merge IT and OT.

“Excellent tool for detailed monitoring. Alarms and notifications work greatly. Equipment addition is straight forward and server initial setup is very easy. ...feel safe to purchase it if you intend to monitor a large networking landscape.”
Infrastructure and Operations Engineer in the Communications Industry, firm size 10B - 30B USD
PRTG makes it easy to monitor your CPU usage.
Custom alerts and data visualization make it easy to monitor, identify, and prevent system performance and stability issues.
Monitor CPU Usage: FAQ
1. What systems is PRTG compatible with?
PRTG CPU load monitoring is compatible with both Windows and Linux/Unix-based systems. PRTG uses SNMP to read the CPU loads of devices made by various manufacturers. You can also use WMI for Windows systems and revert to SSH for Linux-based devices or MacOS.
2. What data does PRTG collect?
PRTG is an all-in-one monitoring tool. It collects data on CPU load, including current computing power as a percentage, in total, and per processor. It monitors the CPU temperature and other health data for various devices, as well as other important system parameters, such as RAM, memory, network cards, hard disk space, bandwidth, and more.
3. How does PRTG CPU load monitoring work?
CPU load monitoring measures computing power as a percentage, which rises with increased process demands. The more processor cores your CPU has, the less strain on each core. As a result, the CPU load will be lower. PRTG monitors the overall processor load and the loads of individual CPU cores.
4. Can CPU load monitoring detect hardware issues?
CPU load monitoring primarily detects performance issues, although consistent high usage can sometimes indicate hardware problems. However, PRTG is a comprehensive monitoring solution that includes hardware monitoring, disk space monitoring, and more.
5. What is a sensor in PRTG?
In PRTG, “sensors” are the basic monitoring elements. One sensor usually monitors one measured value in your network, for example the traffic of a switch port, the CPU load of a server, or the free space on a disk drive.
On average, you need about 5-10 sensors per device or one sensor per switch port.

PRTG: The multi-tool for sysadmins
Adapt PRTG individually and dynamically to your needs and rely on a strong API:- HTTP API: Access monitoring data and manipulate monitoring objects via HTTP requests
- Custom sensors: Create your own PRTG sensors for customized monitoring
- Custom notifications: Create your own notifications and send action triggers to external systems
- REST Custom sensor: Monitor almost everything that provides data in XML or JSON format
We asked: would you recommend PRTG?
Over 95% of our customers say yes!
Paessler AG conducted trials in over 600 IT departments worldwide to tune its network monitoring software closer to the needs of sysadmins.
The result of the survey: over 95% of the participants would recommend PRTG – or already have.

Paessler PRTG is used by companies of all sizes. Sysadmins love PRTG because it makes their job a whole lot easier. Bandwidth, servers, virtual environments, websites, VoIP services – PRTG keeps an eye on your entire network. Everyone has different monitoring needs. That’s why we let you try PRTG for free.Still not convinced?
![]()
More than 500,000
sysadmins love PRTG![]()
Monitor your entire IT infrastructure
![]()
Try Paessler PRTG
for free
![]()
Start monitoring your CPU usage with PRTG and see how it can make your network more reliable and your job easier.
|
PRTG |
Network Monitoring Software - Version 24.2.94.1400 (April 10th, 2024) |
|
Hosting |
Download for Windows and cloud-based version PRTG Hosted Monitor available |
Languages |
English, German, Spanish, French, Portuguese, Dutch, Russian, Japanese, and Simplified Chinese |
Pricing |
Up to 100 sensors for free (Price List) |
Unified Monitoring |
Network devices, bandwidth, servers, applications, virtual environments, remote systems, IoT, and more |
Supported Vendors & Applications |
|